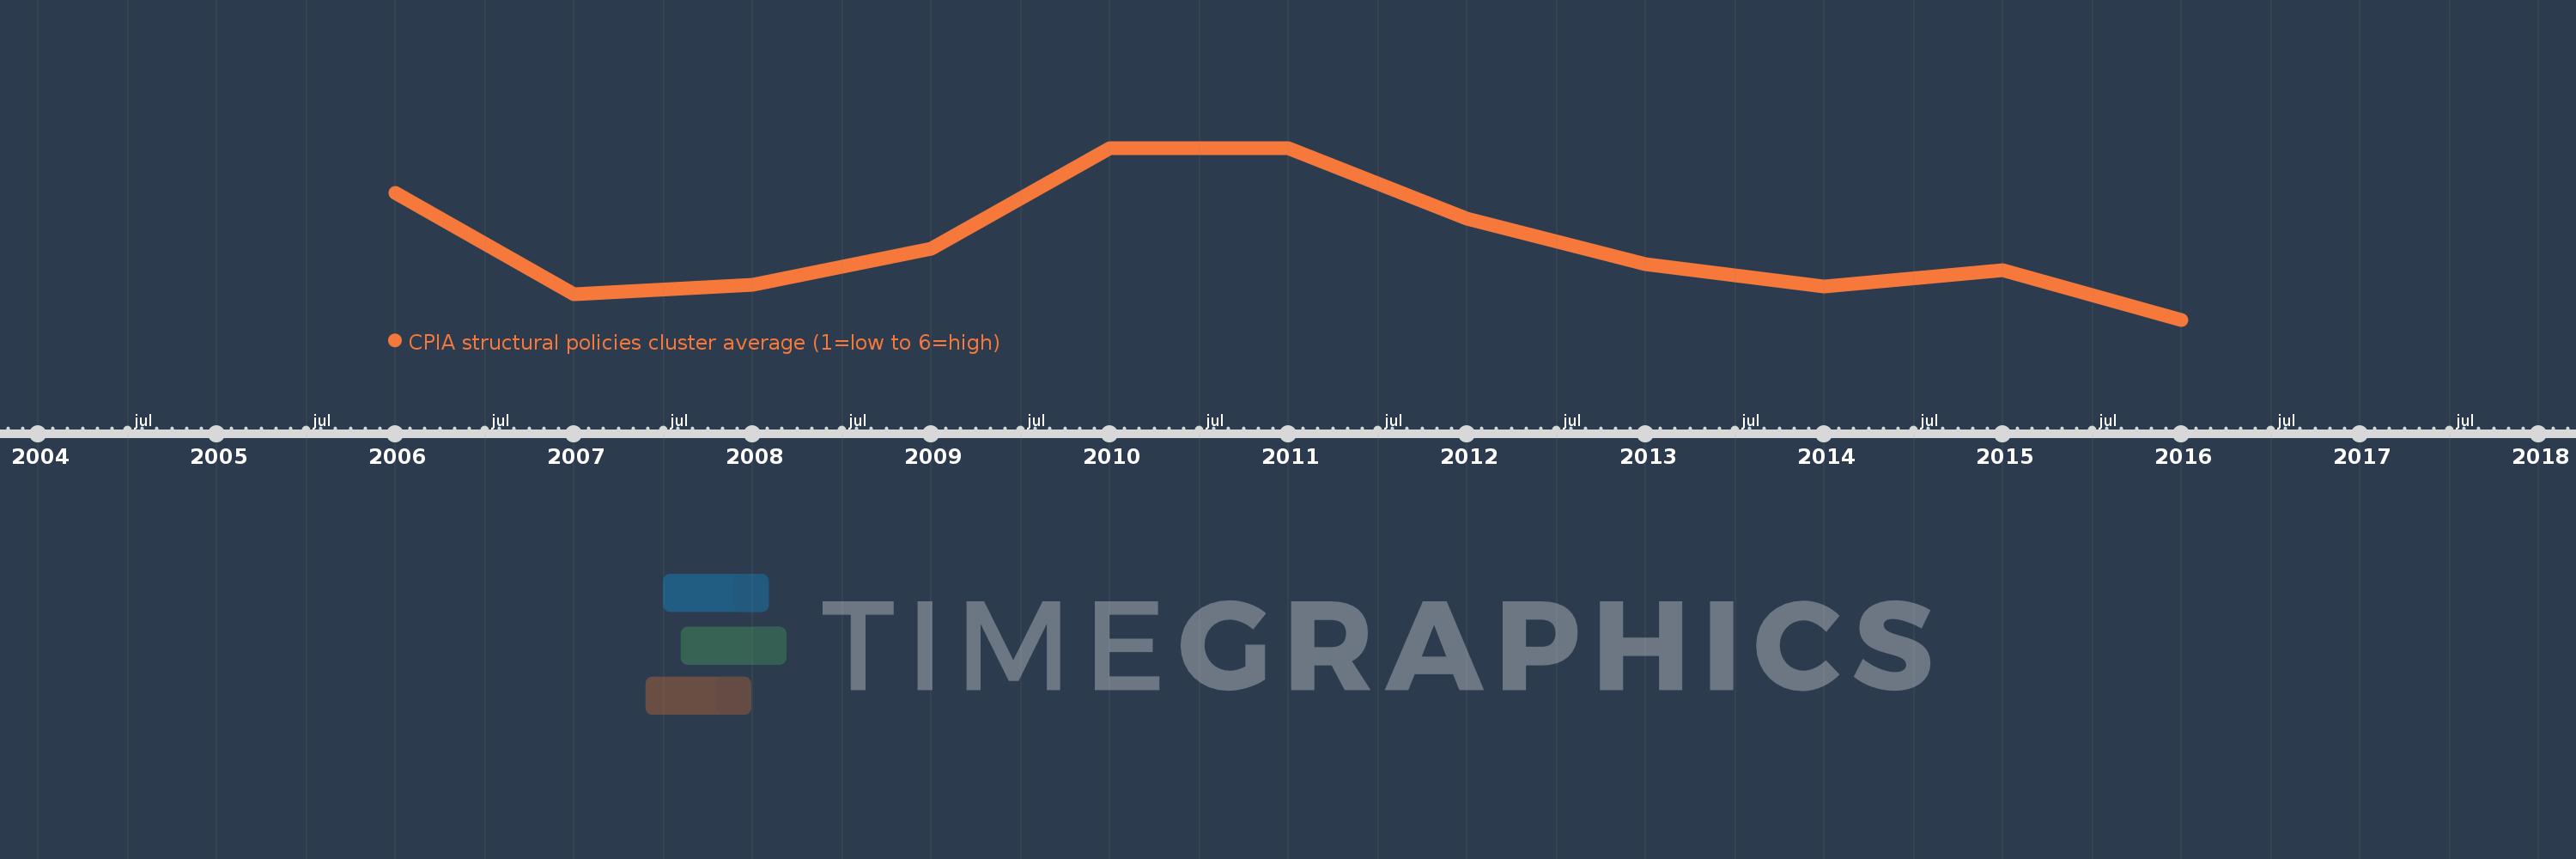
This timeline shows a graph from 2006 to 2016 of East Asia & Pacific (excluding high income). No data until 2005. Number of actual observations by date: 11.
Source name:
World Development Indicators
Source organization:
World Bank Group, CPIA database (http://www.worldbank.org/ida).
Categories, topics:
Public Sector
Last updated:
apr 23, 2017
Indicators value changes by year
Meaning:
3.24
Minimum:
3.189
jan 1, 2016
Maximum:
3.303
jan 1, 2010
At the date of observation
Value
Absolute change
Change from the previous value
jan 1, 2006
3.273
+3.273
0.0%
jan 1, 2007
3.206
-0.067
-2.05%
jan 1, 2008
3.212
+0.007
0.2%
jan 1, 2009
3.236
+0.024
0.75%
jan 1, 2010
3.303
+0.067
2.06%
jan 1, 2011
3.303
0.0
0.0%
jan 1, 2012
3.256
-0.047
-1.41%
jan 1, 2013
3.226
-0.03
-0.93%
jan 1, 2014
3.211
-0.015
-0.47%
jan 1, 2015
3.222
+0.011
0.35%
jan 1, 2016
3.189
-0.033
-1.03%
Ranking of countries by current statistics by years
