29
/
en
AIzaSyAYiBZKx7MnpbEhh9jyipgxe19OcubqV5w
April 1, 2024
276981
United States
USA
true
2
1
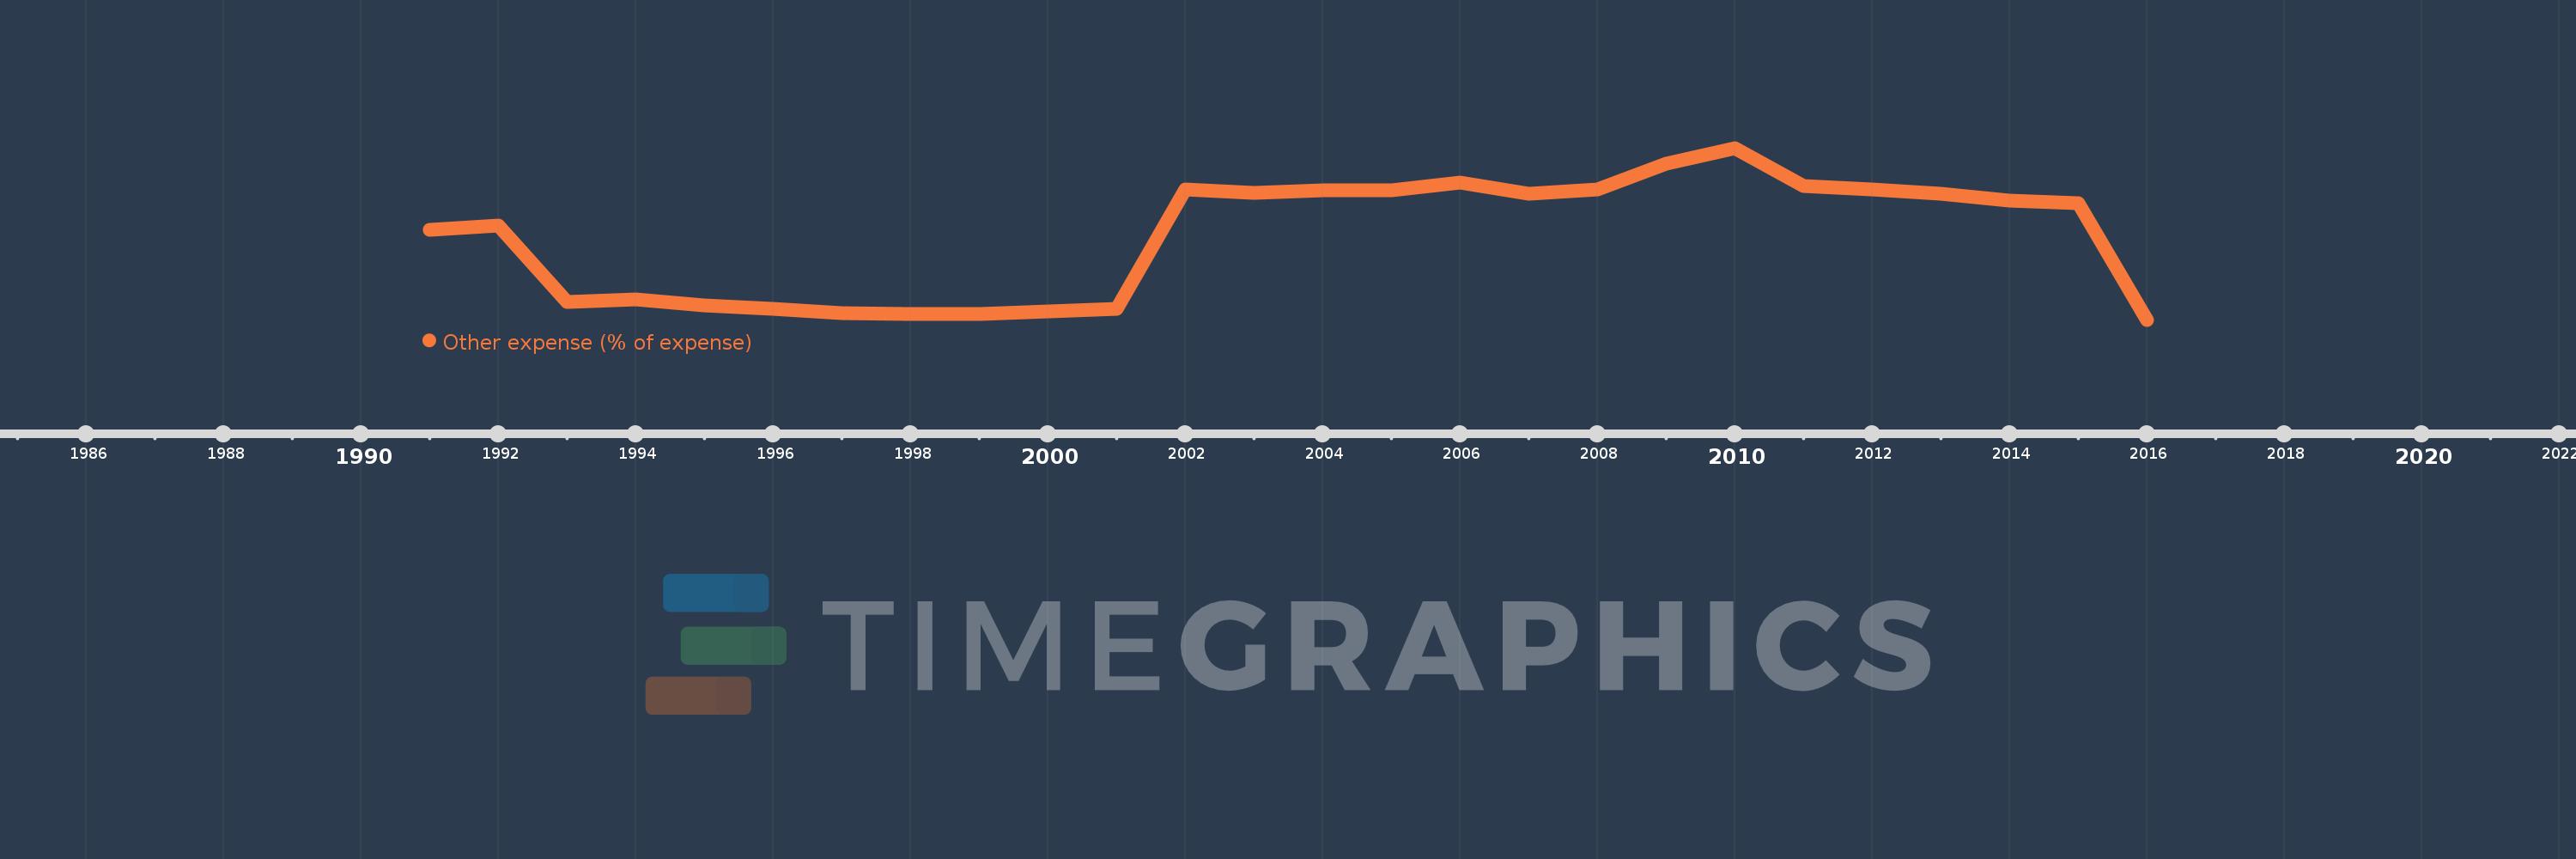
Other expense (% of expense)
2016,2015,2014,2013,2012,2011,2010,2009,2008,2007,2006,2005,2004,2003,2002,2001,2000,1999,1998,1997,1996,1995,1994,1993,1992,1991
This statistics in other country:
AfghanistanAlbaniaAlgeriaAngolaArab WorldArmeniaAustraliaAustriaAzerbaijanBahrainBangladeshBarbadosBelarusBelgiumBelizeBeninBhutanBoliviaBosnia and HerzegovinaBotswanaBrazilBulgariaBurkina FasoBurundiCabo VerdeCambodiaCanadaCaribbean small statesCentral African RepublicCentral Europe and the BalticsChileColombiaCongo, Dem. Rep.Congo, Rep.Costa RicaCote d'IvoireCroatiaCyprusCzech RepublicDenmarkDominican RepublicEarly-demographic dividendEast Asia & PacificEast Asia & Pacific (excluding high income)East Asia & Pacific (IDA & IBRD countries)Egypt, Arab Rep.El SalvadorEquatorial GuineaEstoniaEthiopiaEuro areaEurope & Central AsiaEurope & Central Asia (excluding high income)Europe & Central Asia (IDA & IBRD countries)European UnionFijiFinlandFranceGambia, TheGeorgiaGermanyGhanaGreeceGrenadaGuatemalaHeavily indebted poor countries (HIPC)High incomeHondurasHong Kong SAR, ChinaHungaryIBRD onlyIcelandIDA & IBRD totalIDA onlyIDA totalIndiaIndonesiaIran, Islamic Rep.IraqIrelandIsraelItalyJamaicaJapanJordanKazakhstanKenyaKiribatiKorea, Rep.KuwaitKyrgyz RepublicLao PDRLate-demographic dividendLatin America & Caribbean Latin America & Caribbean (excluding high income)Latin America & the Caribbean (IDA & IBRD countries)LatviaLeast developed countries: UN classificationLebanonLesothoLithuaniaLow & middle incomeLow incomeLower middle incomeLuxembourgMacao SAR, ChinaMacedonia, FYRMadagascarMalawiMalaysiaMaldivesMaliMaltaMauritiusMicronesia, Fed. Sts.Middle East & North AfricaMiddle East & North Africa (excluding high income)Middle East & North Africa (IDA & IBRD countries)Middle incomeMoldovaMongoliaMoroccoMozambiqueNamibiaNepalNetherlandsNew ZealandNicaraguaNorth AmericaNorwayOECD membersOmanOther small statesPakistanPanamaPapua New GuineaParaguayPeruPhilippinesPolandPortugalPost-demographic dividendPre-demographic dividendQatarRomaniaRussian FederationRwandaSamoaSan MarinoSao Tome and PrincipeSerbiaSeychellesSierra LeoneSlovak RepublicSloveniaSmall statesSolomon IslandsSouth AfricaSouth AsiaSouth Asia (IDA & IBRD)SpainSri LankaSub-Saharan Africa Sub-Saharan Africa (excluding high income)Sub-Saharan Africa (IDA & IBRD countries)SurinameSwazilandSwedenSwitzerlandTajikistanTanzaniaThailandTimor-LesteTogoTrinidad and TobagoTunisiaTurkeyUgandaUkraineUnited Arab EmiratesUnited KingdomUnited StatesUpper middle incomeUruguayVanuatuVenezuela, RBWest Bank and GazaWorldYemen, Rep.Zambia Timeline:
This timeline shows a graph from 1991 to 2016 of United States. No data until 1990. Number of actual observations by date: 26.
Source name:
World Development Indicators
Source organization:
International Monetary Fund, Government Finance Statistics Yearbook and data files.
Categories, topics:
Public Sector
Last updated:
apr 23, 2017
Indicators value changes by year
At the date of observation
Value
Absolute change
Change from previous value
jan 1, 1991
5.293
+5.293
0.0%
jan 1, 1992
5.554
+0.262
4.94%
jan 1, 1993
1.176
-4.378
-78.83%
jan 1, 1994
1.356
+0.18
15.31%
jan 1, 1995
0.986
-0.37
-27.27%
jan 1, 1996
0.794
-0.193
-19.53%
jan 1, 1997
0.567
-0.227
-28.62%
jan 1, 1998
0.497
-0.07
-12.34%
jan 1, 1999
0.525
+0.028
5.62%
jan 1, 2000
0.641
+0.116
22.12%
jan 1, 2001
0.802
+0.161
25.13%
jan 1, 2002
7.601
+6.799
848.23%
jan 1, 2003
7.392
-0.209
-2.75%
jan 1, 2004
7.558
+0.166
2.24%
jan 1, 2005
7.54
-0.018
-0.24%
jan 1, 2006
7.978
+0.438
5.81%
jan 1, 2007
7.373
-0.605
-7.58%
jan 1, 2008
7.612
+0.24
3.25%
jan 1, 2009
9.08
+1.467
19.28%
jan 1, 2010
9.973
+0.894
9.84%
jan 1, 2011
7.788
-2.185
-21.91%
jan 1, 2012
7.613
-0.175
-2.24%
jan 1, 2013
7.353
-0.261
-3.42%
jan 1, 2014
6.984
-0.369
-5.02%
jan 1, 2015
6.83
-0.154
-2.2%
jan 1, 2016
0.18
-6.65
-97.37%
Ranking of countries by current statistics by years


Comments: