29
/
en
AIzaSyAYiBZKx7MnpbEhh9jyipgxe19OcubqV5w
April 1, 2024
276891
United States
USA
true
2
1
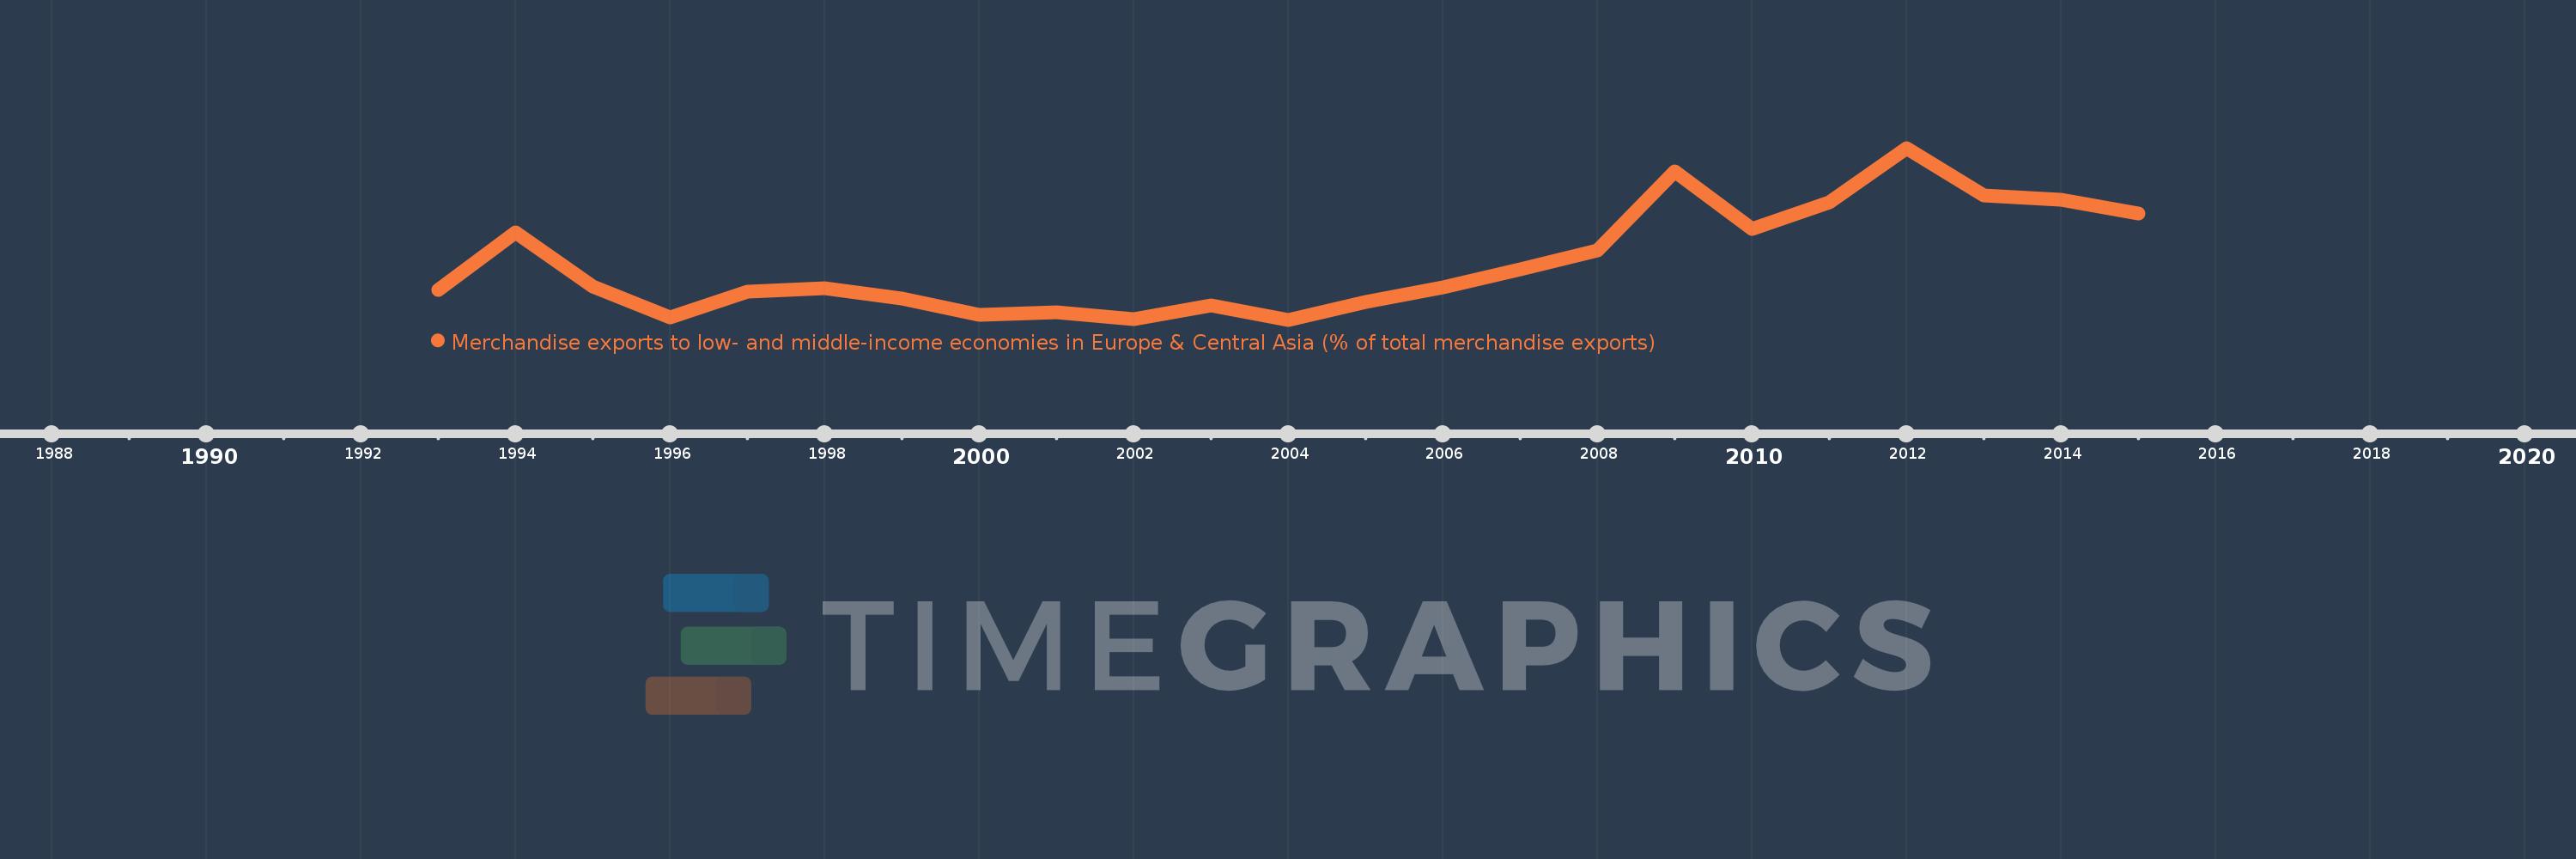
Merchandise exports to low- and middle-income economies in Europe & Central Asia (% of total merchandise exports)
2015,2014,2013,2012,2011,2010,2009,2008,2007,2006,2005,2004,2003,2002,2001,2000,1999,1998,1997,1996,1995,1994,1993
This statistics in other country:
AfghanistanAlbaniaAlgeriaArab WorldArgentinaArmeniaArubaAustraliaAustriaAzerbaijanBahamas, TheBahrainBangladeshBarbadosBelarusBelgiumBoliviaBosnia and HerzegovinaBrazilBulgariaCameroonCanadaCaribbean small statesCentral Europe and the BalticsChileChinaColombiaCongo, Rep.Costa RicaCote d'IvoireCroatiaCubaCyprusCzech RepublicDenmarkDominicaEarly-demographic dividendEast Asia & PacificEast Asia & Pacific (excluding high income)East Asia & Pacific (IDA & IBRD countries)EcuadorEgypt, Arab Rep.El SalvadorEstoniaEthiopiaEuro areaEurope & Central AsiaEurope & Central Asia (excluding high income)Europe & Central Asia (IDA & IBRD countries)European UnionFinlandFragile and conflict affected situationsFranceGeorgiaGermanyGhanaGibraltarGreeceGreenlandGuatemalaGuineaHeavily indebted poor countries (HIPC)High incomeHondurasHong Kong SAR, ChinaHungaryIBRD onlyIcelandIDA & IBRD totalIDA blendIDA onlyIDA totalIndiaIndonesiaIran, Islamic Rep.IraqIrelandIsraelItalyJamaicaJapanJordanKazakhstanKenyaKorea, Dem. People’s Rep.Korea, Rep.KuwaitKyrgyz RepublicLate-demographic dividendLatin America & Caribbean Latin America & Caribbean (excluding high income)Latin America & the Caribbean (IDA & IBRD countries)LatviaLeast developed countries: UN classificationLebanonLiberiaLibyaLithuaniaLow & middle incomeLow incomeLower middle incomeLuxembourgMacao SAR, ChinaMacedonia, FYRMadagascarMalaysiaMaldivesMaltaMauritaniaMauritiusMiddle East & North AfricaMiddle East & North Africa (excluding high income)Middle East & North Africa (IDA & IBRD countries)Middle incomeMoldovaMongoliaMontenegroMoroccoNetherlandsNew CaledoniaNew ZealandNigeriaNorth AmericaNorwayOECD membersOmanOther small statesPacific island small statesPakistanPanamaParaguayPeruPhilippinesPolandPortugalPost-demographic dividendPre-demographic dividendQatarRomaniaRussian FederationSaudi ArabiaSenegalSerbiaSingaporeSlovak RepublicSloveniaSmall statesSouth AfricaSouth AsiaSouth Asia (IDA & IBRD)SpainSri LankaSt. Kitts and NevisSub-Saharan Africa Sub-Saharan Africa (excluding high income)Sub-Saharan Africa (IDA & IBRD countries)SudanSwedenSwitzerlandSyrian Arab RepublicTajikistanTanzaniaThailandTogoTongaTrinidad and TobagoTunisiaTurkeyTurkmenistanUgandaUkraineUnited Arab EmiratesUnited KingdomUnited StatesUpper middle incomeUruguayUzbekistanVenezuela, RBVietnamWorldYemen, Rep.ZambiaZimbabwe Timeline:
This timeline shows a graph from 1993 to 2015 of United States. No data until 1992. Number of actual observations by date: 23.
Source name:
World Development Indicators
Source organization:
World Bank staff estimates based data from International Monetary Fund's Direction of Trade database.
Categories, topics:
Private Sector, Trade
Last updated:
apr 23, 2017
Indicators value changes by year
At the date of observation
Value
Absolute change
Change from previous value
jan 1, 1993
0.784
+0.784
0.0%
jan 1, 1994
1.031
+0.247
31.47%
jan 1, 1995
0.796
-0.235
-22.77%
jan 1, 1996
0.662
-0.135
-16.9%
jan 1, 1997
0.774
+0.112
16.94%
jan 1, 1998
0.789
+0.015
1.97%
jan 1, 1999
0.746
-0.042
-5.38%
jan 1, 2000
0.673
-0.073
-9.8%
jan 1, 2001
0.686
+0.013
1.91%
jan 1, 2002
0.656
-0.03
-4.39%
jan 1, 2003
0.716
+0.06
9.11%
jan 1, 2004
0.653
-0.062
-8.72%
jan 1, 2005
0.732
+0.079
12.09%
jan 1, 2006
0.792
+0.06
8.23%
jan 1, 2007
0.872
+0.079
9.99%
jan 1, 2008
0.954
+0.082
9.44%
jan 1, 2009
1.297
+0.343
35.92%
jan 1, 2010
1.046
-0.251
-19.34%
jan 1, 2011
1.164
+0.118
11.3%
jan 1, 2012
1.399
+0.235
20.22%
jan 1, 2013
1.192
-0.207
-14.83%
jan 1, 2014
1.174
-0.018
-1.53%
jan 1, 2015
1.114
-0.06
-5.11%
Ranking of countries by current statistics by years


Comments: