29
/
en
AIzaSyAYiBZKx7MnpbEhh9jyipgxe19OcubqV5w
April 1, 2024
274114
Ukraine
UKR
true
2
1
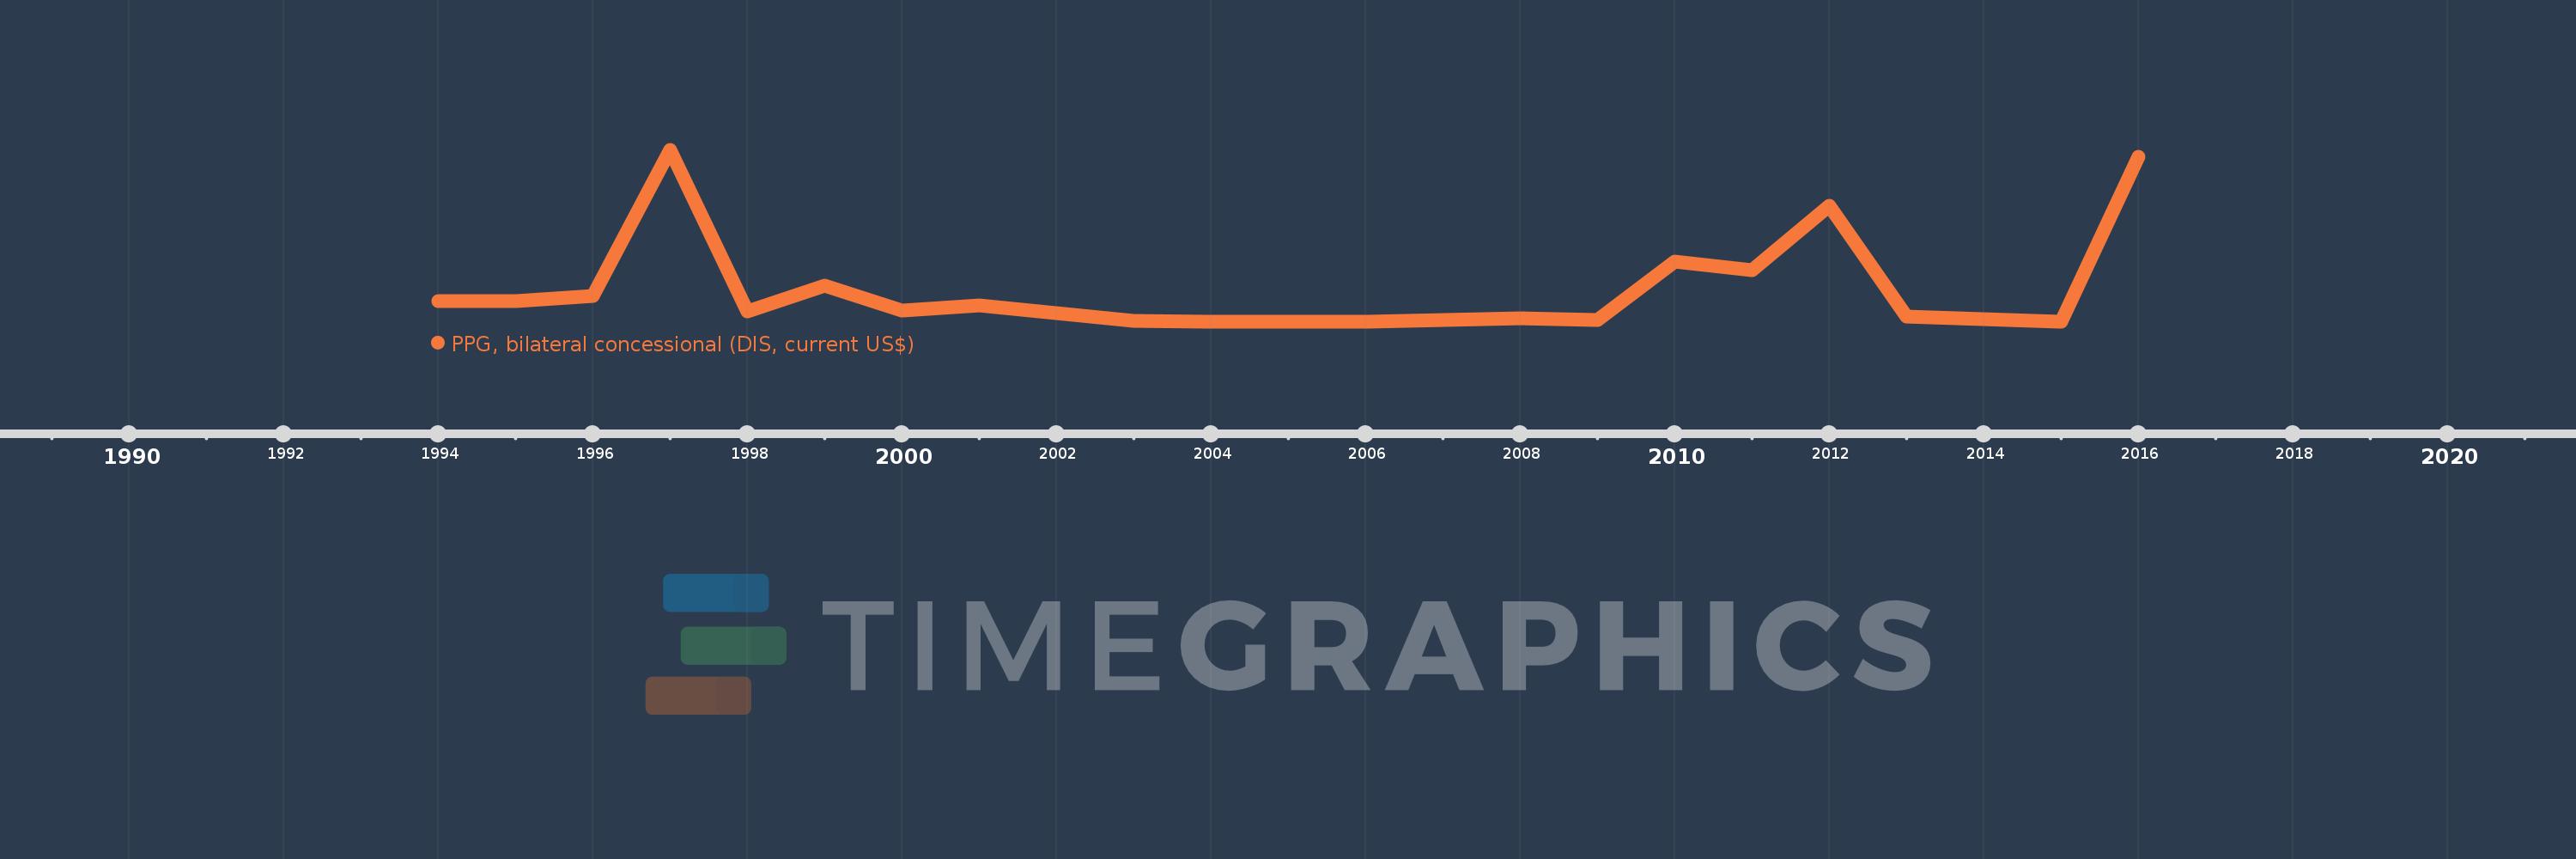
PPG, bilateral concessional (DIS, current US$)
2016,2015,2013,2012,2011,2010,2009,2008,2006,2004,2003,2002,2001,2000,1999,1998,1997,1996,1995,1994
This statistics in other country:
Timeline:
This timeline shows a graph from 1994 to 2016 of Ukraine. No data until 1993. Number of actual observations by date: 20.
Source name:
World Development Indicators
Source organization:
World Bank, International Debt Statistics.
Categories, topics:
External Debt
Last updated:
apr 23, 2017
Indicators value changes by year
Maximum:
162.496 mln
jan 1, 1997
At the date of observation
Value
Absolute change
Change from previous value
jan 1, 1994
19.592 mln
+19.592 mln
0.0%
jan 1, 1995
19.904 mln
+312.0K
1.59%
jan 1, 1996
24.79 mln
+4.886 mln
24.55%
jan 1, 1997
162.496 mln
+137.706 mln
555.49%
jan 1, 1998
9.999 mln
-152.497 mln
-93.85%
jan 1, 1999
34.439 mln
+24.44 mln
244.42%
jan 1, 2000
10.681 mln
-23.758 mln
-68.99%
jan 1, 2001
15.723 mln
+5.042 mln
47.21%
jan 1, 2002
8.022 mln
-7.701 mln
-48.98%
jan 1, 2003
1.229 mln
-6.793 mln
-84.68%
jan 1, 2004
69.0K
-1.16 mln
-94.39%
jan 1, 2006
595.0K
+526.0K
762.32%
jan 1, 2008
3.171 mln
+2.576 mln
432.94%
jan 1, 2009
1.571 mln
-1.6 mln
-50.46%
jan 1, 2010
57.11 mln
+55.539 mln
3.54K%
jan 1, 2011
48.821 mln
-8.289 mln
-14.51%
jan 1, 2012
109.973 mln
+61.152 mln
125.26%
jan 1, 2013
5.124 mln
-104.849 mln
-95.34%
jan 1, 2015
0.0
-5.124 mln
-100.0%
jan 1, 2016
156.583 mln
+156.583 mln
%
Ranking of countries by current statistics by years


Comments: