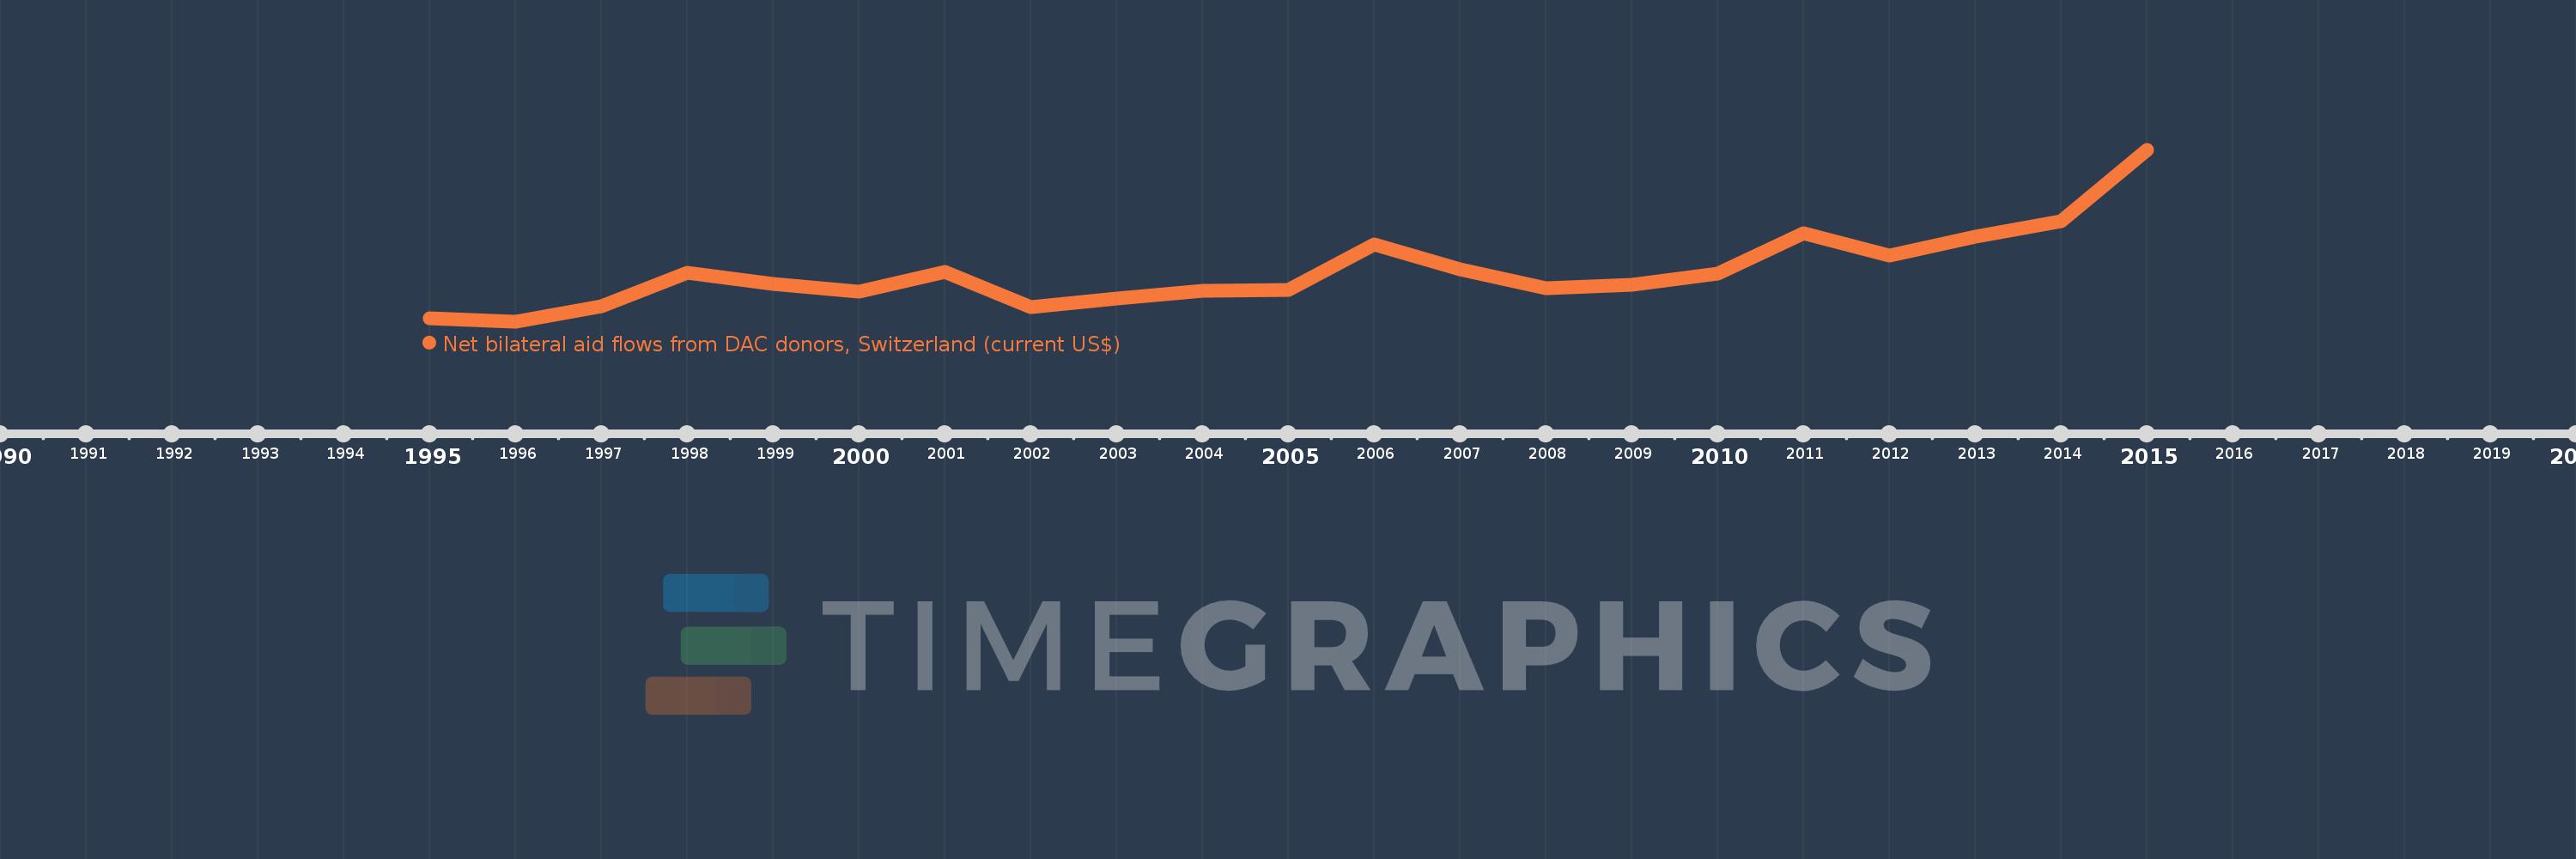
This timeline shows a graph from 1995 to 2015 of Ukraine. No data until 1994. Number of actual observations by date: 21.
Source name:
World Development Indicators
Source organization:
Development Assistance Committee of the Organisation for Economic Co-operation and Development, Geographical Distribution of Financial Flows to Developing Countries, Development Co-operation Report, and International Development Statistics database. Data are available online at: www.oecd.org/dac/stats/idsonline.
Categories, topics:
Aid Effectiveness
Last updated:
apr 23, 2017
Indicators value changes by year
Meaning:
8.793 mln
Minimum:
240.0K
jan 1, 1996
Maximum:
29.61 mln
jan 1, 2015
At the date of observation
Value
Absolute change
Change from the previous value
jan 1, 1995
830.0K
+830.0K
0.0%
jan 1, 1996
240.0K
-590.0K
-71.08%
jan 1, 1997
2.91 mln
+2.67 mln
1.11K%
jan 1, 1998
8.7 mln
+5.79 mln
198.97%
jan 1, 1999
6.7 mln
-2.0 mln
-22.99%
jan 1, 2000
5.39 mln
-1.31 mln
-19.55%
jan 1, 2001
8.78 mln
+3.39 mln
62.89%
jan 1, 2002
2.79 mln
-5.99 mln
-68.22%
jan 1, 2003
4.2 mln
+1.41 mln
50.54%
jan 1, 2004
5.51 mln
+1.31 mln
31.19%
jan 1, 2005
5.79 mln
+280.0K
5.08%
jan 1, 2006
13.45 mln
+7.66 mln
132.3%
jan 1, 2007
9.21 mln
-4.24 mln
-31.52%
jan 1, 2008
5.96 mln
-3.25 mln
-35.29%
jan 1, 2009
6.63 mln
+670.0K
11.24%
jan 1, 2010
8.55 mln
+1.92 mln
28.96%
jan 1, 2011
15.46 mln
+6.91 mln
80.82%
jan 1, 2012
11.6 mln
-3.86 mln
-24.97%
jan 1, 2013
14.86 mln
+3.26 mln
28.1%
jan 1, 2014
17.49 mln
+2.63 mln
17.7%
jan 1, 2015
29.61 mln
+12.12 mln
69.3%
Ranking of countries by current statistics by years
