30
/
AIzaSyAYiBZKx7MnpbEhh9jyipgxe19OcubqV5w
April 1, 2024
273914
Ukraine
UKR
true
2
1
Multilateral debt service (TDS, current US$)
2016,2015,2014,2013,2012,2011,2010,2009,2008,2007,2006,2005,2004,2003,2002,2001,2000,1999,1998,1997,1996,1995,1994
Public Timelines
FAQ
Menu
Public Timelines
FAQ
Public Timelines
FAQ
For education
For educational institutions
For teachers
For students
Open cabinet
For educational institutions
For teachers
For students
Open cabinet
Create
Close
Create a timeline
Public timelines
Library
FAQ
Download
Global statistics library
→
Ukraine
→
Multilateral debt service (TDS, current US$)
This statistics in other country:
Afghanistan
Albania
Algeria
Angola
Argentina
Armenia
Azerbaijan
Bangladesh
Belarus
Belize
Benin
Bhutan
Bolivia
Bosnia and Herzegovina
Botswana
Brazil
Bulgaria
Burkina Faso
Burundi
Cabo Verde
Cambodia
Cameroon
Central African Republic
Chad
China
Colombia
Comoros
Congo, Dem. Rep.
Congo, Rep.
Costa Rica
Cote d'Ivoire
Djibouti
Dominica
Dominican Republic
East Asia & Pacific (excluding high income)
Ecuador
Egypt, Arab Rep.
El Salvador
Eritrea
Ethiopia
Europe & Central Asia (excluding high income)
Fiji
Gabon
Gambia, The
Georgia
Ghana
Grenada
Guatemala
Guinea
Guinea-Bissau
Guyana
Haiti
Honduras
IDA only
India
Indonesia
Iran, Islamic Rep.
Jamaica
Jordan
Kazakhstan
Kenya
Kosovo
Kyrgyz Republic
Lao PDR
Latin America & Caribbean (excluding high income)
Lebanon
Lesotho
Liberia
Low & middle income
Low income
Lower middle income
Macedonia, FYR
Madagascar
Malawi
Malaysia
Maldives
Mali
Mauritania
Mauritius
Mexico
Middle East & North Africa (excluding high income)
Middle income
Moldova
Mongolia
Montenegro
Morocco
Mozambique
Myanmar
Nepal
Nicaragua
Niger
Nigeria
Pakistan
Panama
Papua New Guinea
Paraguay
Peru
Philippines
Romania
Russian Federation
Rwanda
Samoa
Sao Tome and Principe
Senegal
Serbia
Sierra Leone
Solomon Islands
Somalia
South Africa
South Asia
Sri Lanka
St. Lucia
St. Vincent and the Grenadines
Sub-Saharan Africa (excluding high income)
Sudan
Swaziland
Syrian Arab Republic
Tajikistan
Tanzania
Thailand
Togo
Tonga
Tunisia
Turkey
Turkmenistan
Uganda
Ukraine
Upper middle income
Uzbekistan
Vanuatu
Venezuela, RB
Vietnam
Yemen, Rep.
Zambia
Zimbabwe
Timeline:
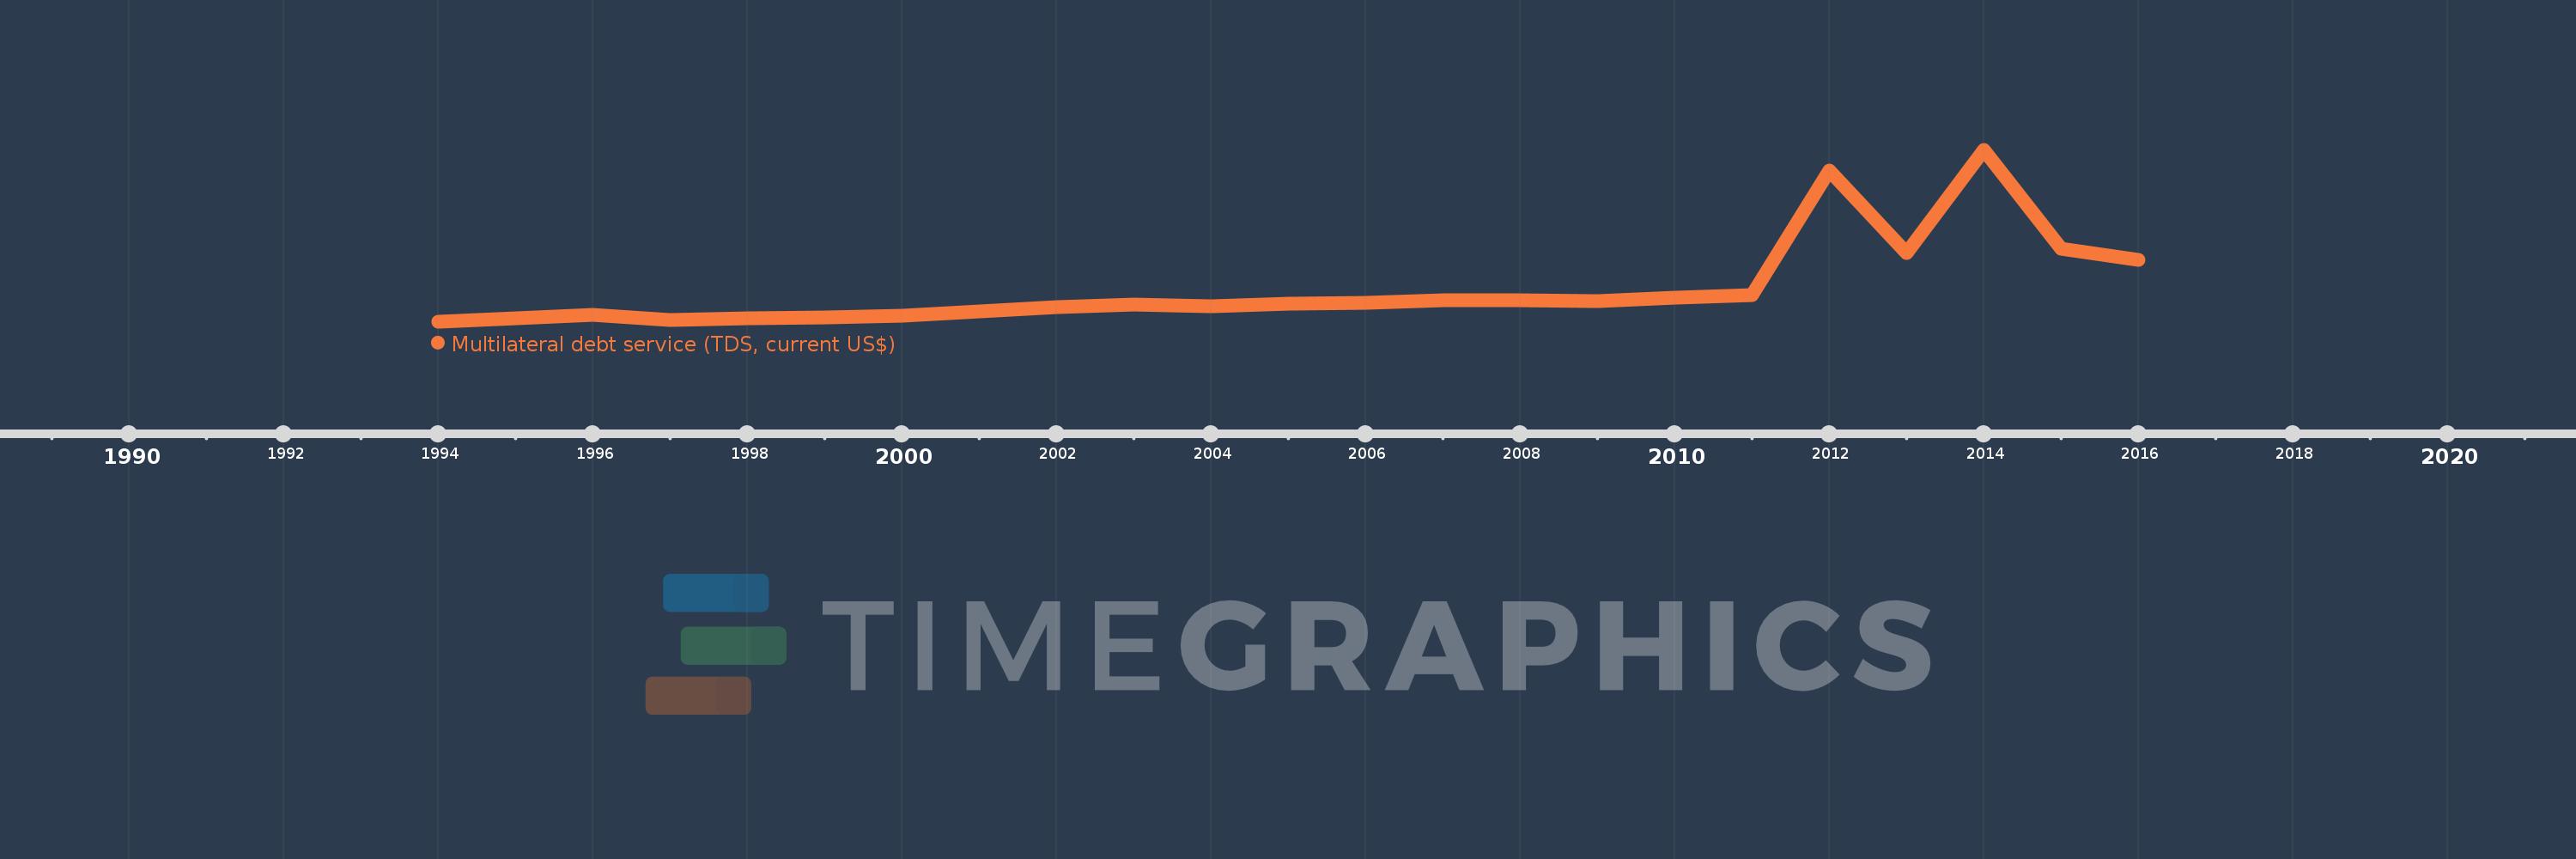
This timeline shows a graph from
1994
to
2016
of Ukraine. No data until
1993
. Number of actual observations by date:
23
.
Source name:
World Development Indicators
Source organization:
World Bank, International Debt Statistics.
Categories, topics:
External Debt
Last updated:
apr 23, 2017
Indicators value changes by year
Meaning:
640.45 mln
Minimum:
9.016 mln
jan 1, 1994
Maximum:
3.273 bln
jan 1, 2014
At the date of observation
Value
Absolute change
Change from the previous value
jan 1, 1994
9.016 mln
+9.016 mln
0.0%
jan 1, 1995
77.001 mln
+67.985 mln
754.05%
jan 1, 1996
140.52 mln
+63.519 mln
82.49%
jan 1, 1997
40.399 mln
-100.121 mln
-71.25%
jan 1, 1998
71.432 mln
+31.033 mln
76.82%
jan 1, 1999
95.471 mln
+24.039 mln
33.65%
jan 1, 2000
127.15 mln
+31.679 mln
33.18%
jan 1, 2001
211.078 mln
+83.928 mln
66.01%
jan 1, 2002
288.368 mln
+77.29 mln
36.62%
jan 1, 2003
341.685 mln
+53.317 mln
18.49%
jan 1, 2004
299.623 mln
-42.062 mln
-12.31%
jan 1, 2005
355.508 mln
+55.885 mln
18.65%
jan 1, 2006
379.138 mln
+23.63 mln
6.65%
jan 1, 2007
417.935 mln
+38.797 mln
10.23%
jan 1, 2008
428.572 mln
+10.637 mln
2.55%
jan 1, 2009
400.093 mln
-28.479 mln
-6.65%
jan 1, 2010
476.183 mln
+76.09 mln
19.02%
jan 1, 2011
512.226 mln
+36.043 mln
7.57%
jan 1, 2012
2.883 bln
+2.371 bln
462.84%
jan 1, 2013
1.315 bln
-1.568 bln
-54.4%
jan 1, 2014
3.273 bln
+1.959 bln
148.99%
jan 1, 2015
1.4 bln
-1.874 bln
-57.24%
jan 1, 2016
1.189 bln
-210.96 mln
-15.07%
Ranking of countries by current statistics by years
About & Feedback
Terms
Privacy
Library
2024
©
Time.Graphics
Support 24/7
Cabinet
Get premium
Donate
The service accepts bank transfer (ACH, Wire) or cards (Visa, MasterCard, etc). Processed by Stripe.
Secured with SSL
Excellent (Trustpilot Reviews)
Based on 115+ reviews
Write your own review on
Trustpilot.com
