29
/
en
AIzaSyAYiBZKx7MnpbEhh9jyipgxe19OcubqV5w
April 1, 2024
272021
Uganda
UGA
true
2
1
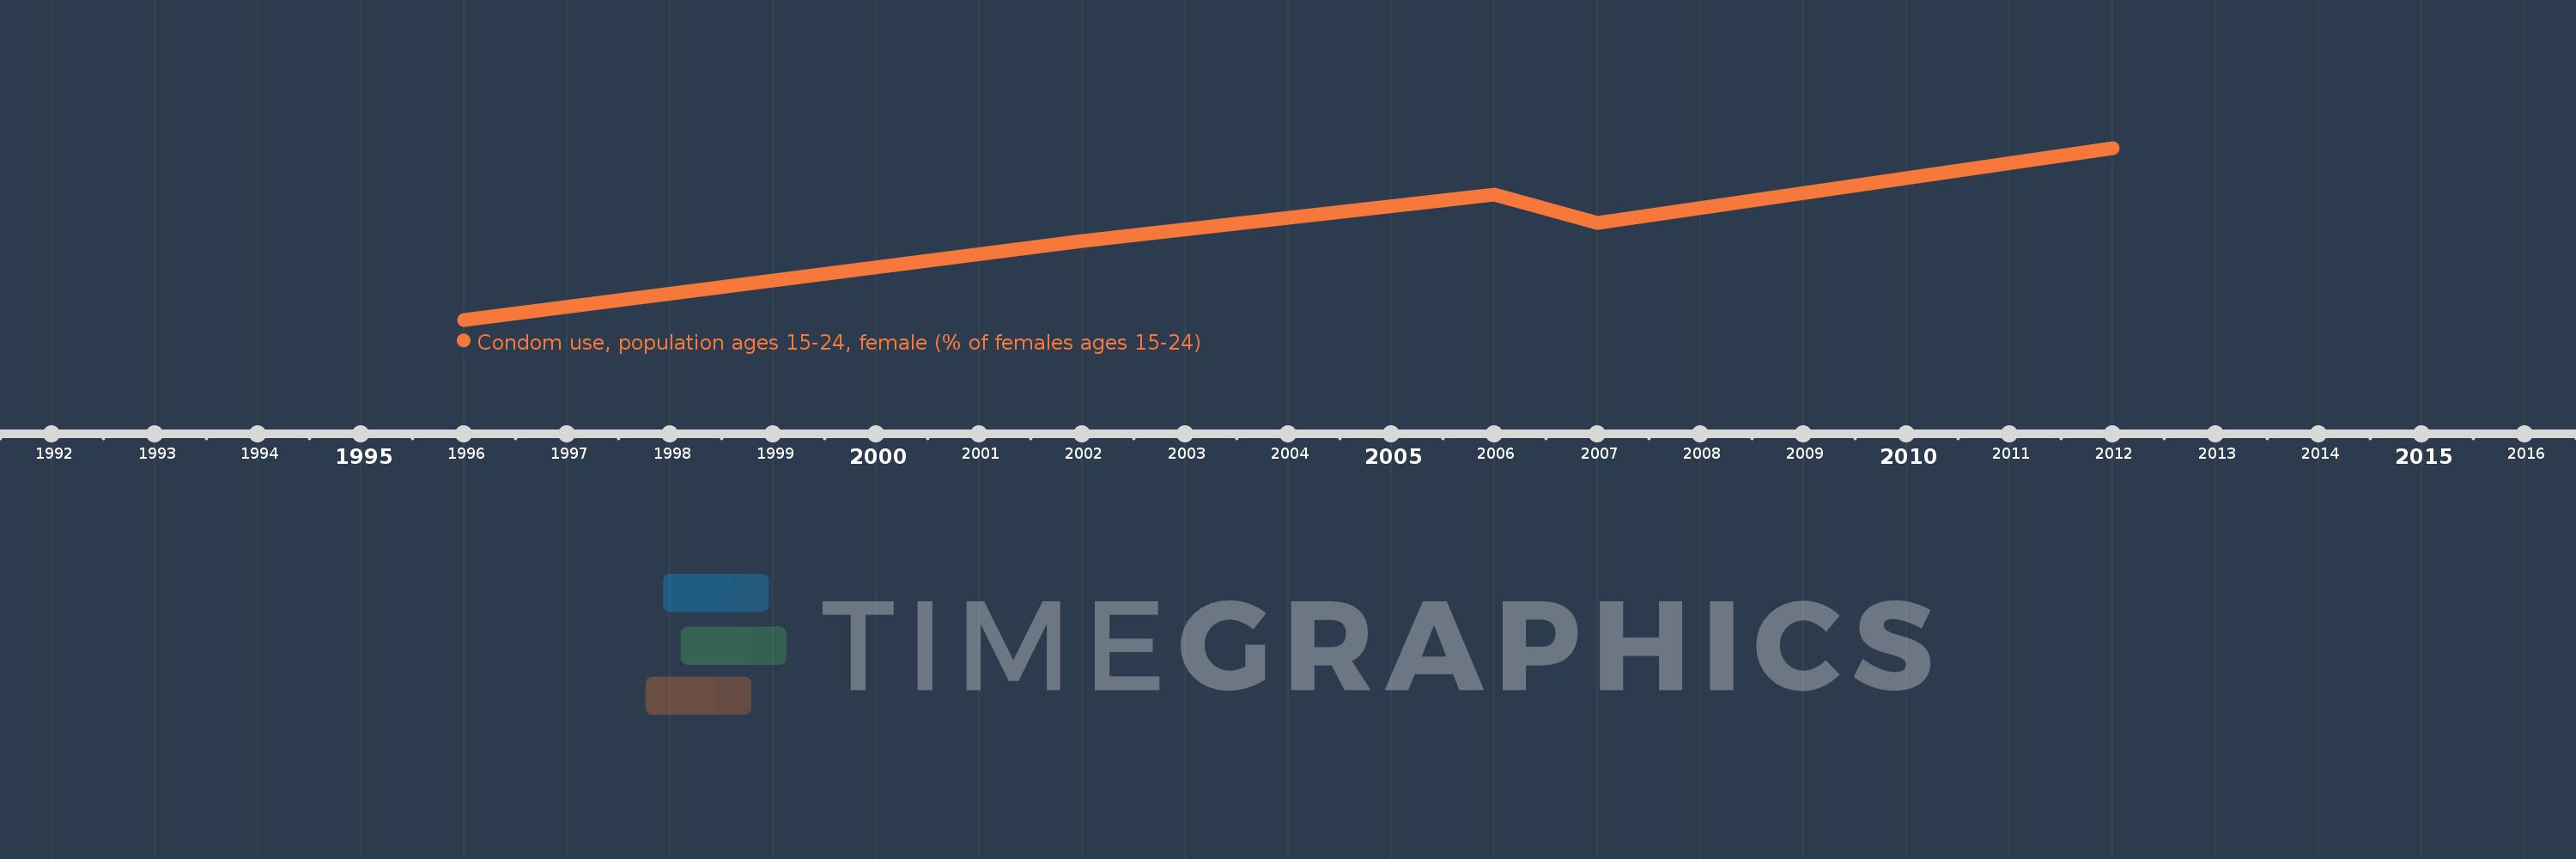
Condom use, population ages 15-24, female (% of females ages 15-24)
2012,2007,2006,2002,1996
This statistics in other country:
Timeline:
This timeline shows a graph from 1996 to 2012 of Uganda. No data until 1995. Number of actual observations by date: 5.
Source name:
World Development Indicators
Source organization:
Demographic and Health Surveys, and UNAIDS.
Categories, topics:
Health, Gender
Last updated:
apr 23, 2017
Indicators value changes by year
At the date of observation
Value
Absolute change
Change from previous value
jan 1, 2002
11.2
+6.7
148.89%
jan 1, 2006
15.1
+3.9
34.82%
jan 1, 2007
12.7
-2.4
-15.89%
jan 1, 2012
19.1
+6.4
50.39%
Ranking of countries by current statistics by years


Comments: