Download This statistics in other country:
Timeline:
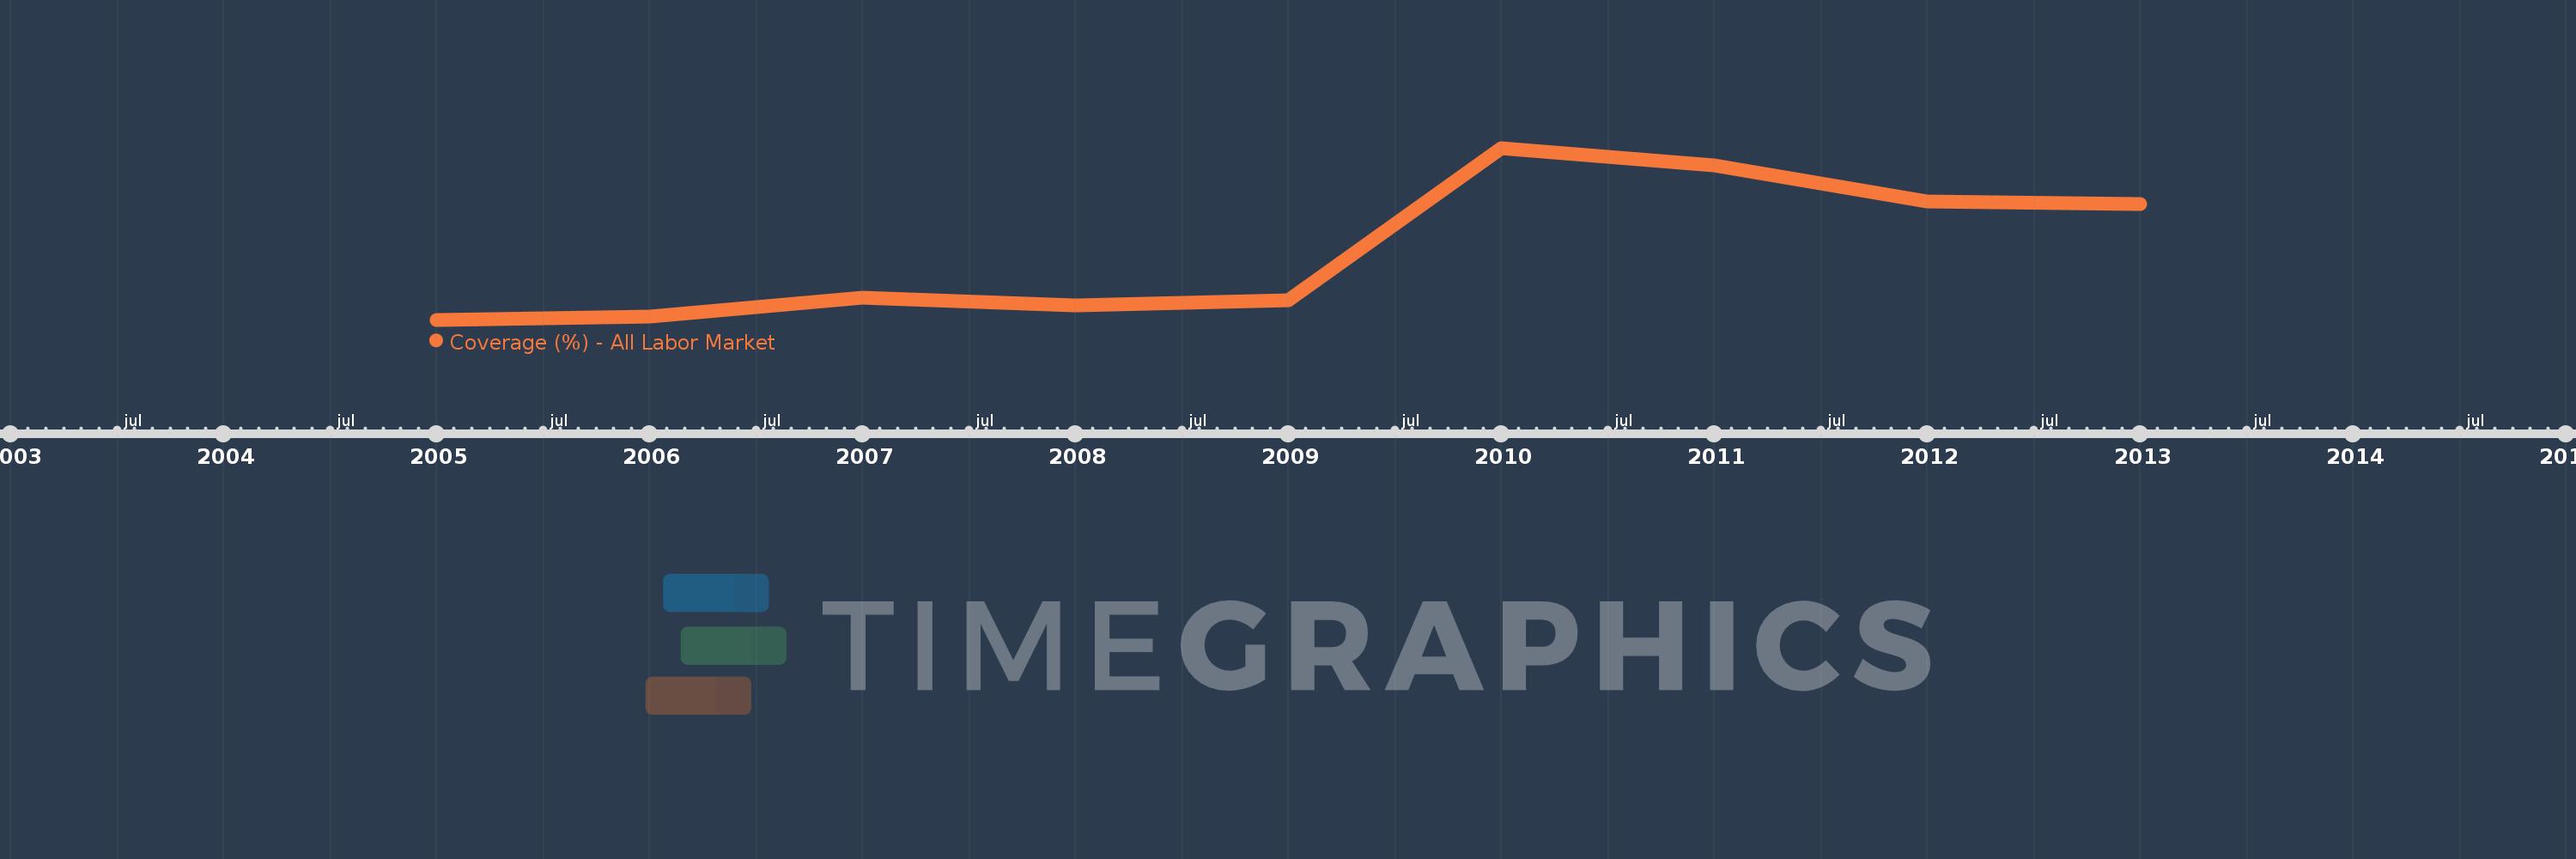
This timeline shows a graph from 2005 to 2013 of Turkey. No data until 2004. Number of actual observations by date: 9.
Source name:
World Development Indicators
Source organization:
The Atlas of Social Protection: Indicators of Resilience and Equity (ASPIRE)
Categories, topics:
Social Protection & Labor
Last updated:
apr 23, 2017
Indicators value changes by year
At the date of observation
Value
Absolute change
Change from the previous value
jan 1, 2005
0.223
+0.223
0.0%
jan 1, 2006
0.238
+0.015
6.85%
jan 1, 2007
0.341
+0.103
43.15%
jan 1, 2008
0.301
-0.04
-11.8%
jan 1, 2009
0.326
+0.026
8.51%
jan 1, 2010
1.139
+0.813
249.02%
jan 1, 2011
1.045
-0.095
-8.33%
jan 1, 2012
0.853
-0.191
-18.31%
jan 1, 2013
0.841
-0.012
-1.46%
Ranking of countries by current statistics by years
