30
/
AIzaSyAYiBZKx7MnpbEhh9jyipgxe19OcubqV5w
April 1, 2024
268885
Turkey
TUR
true
2
1
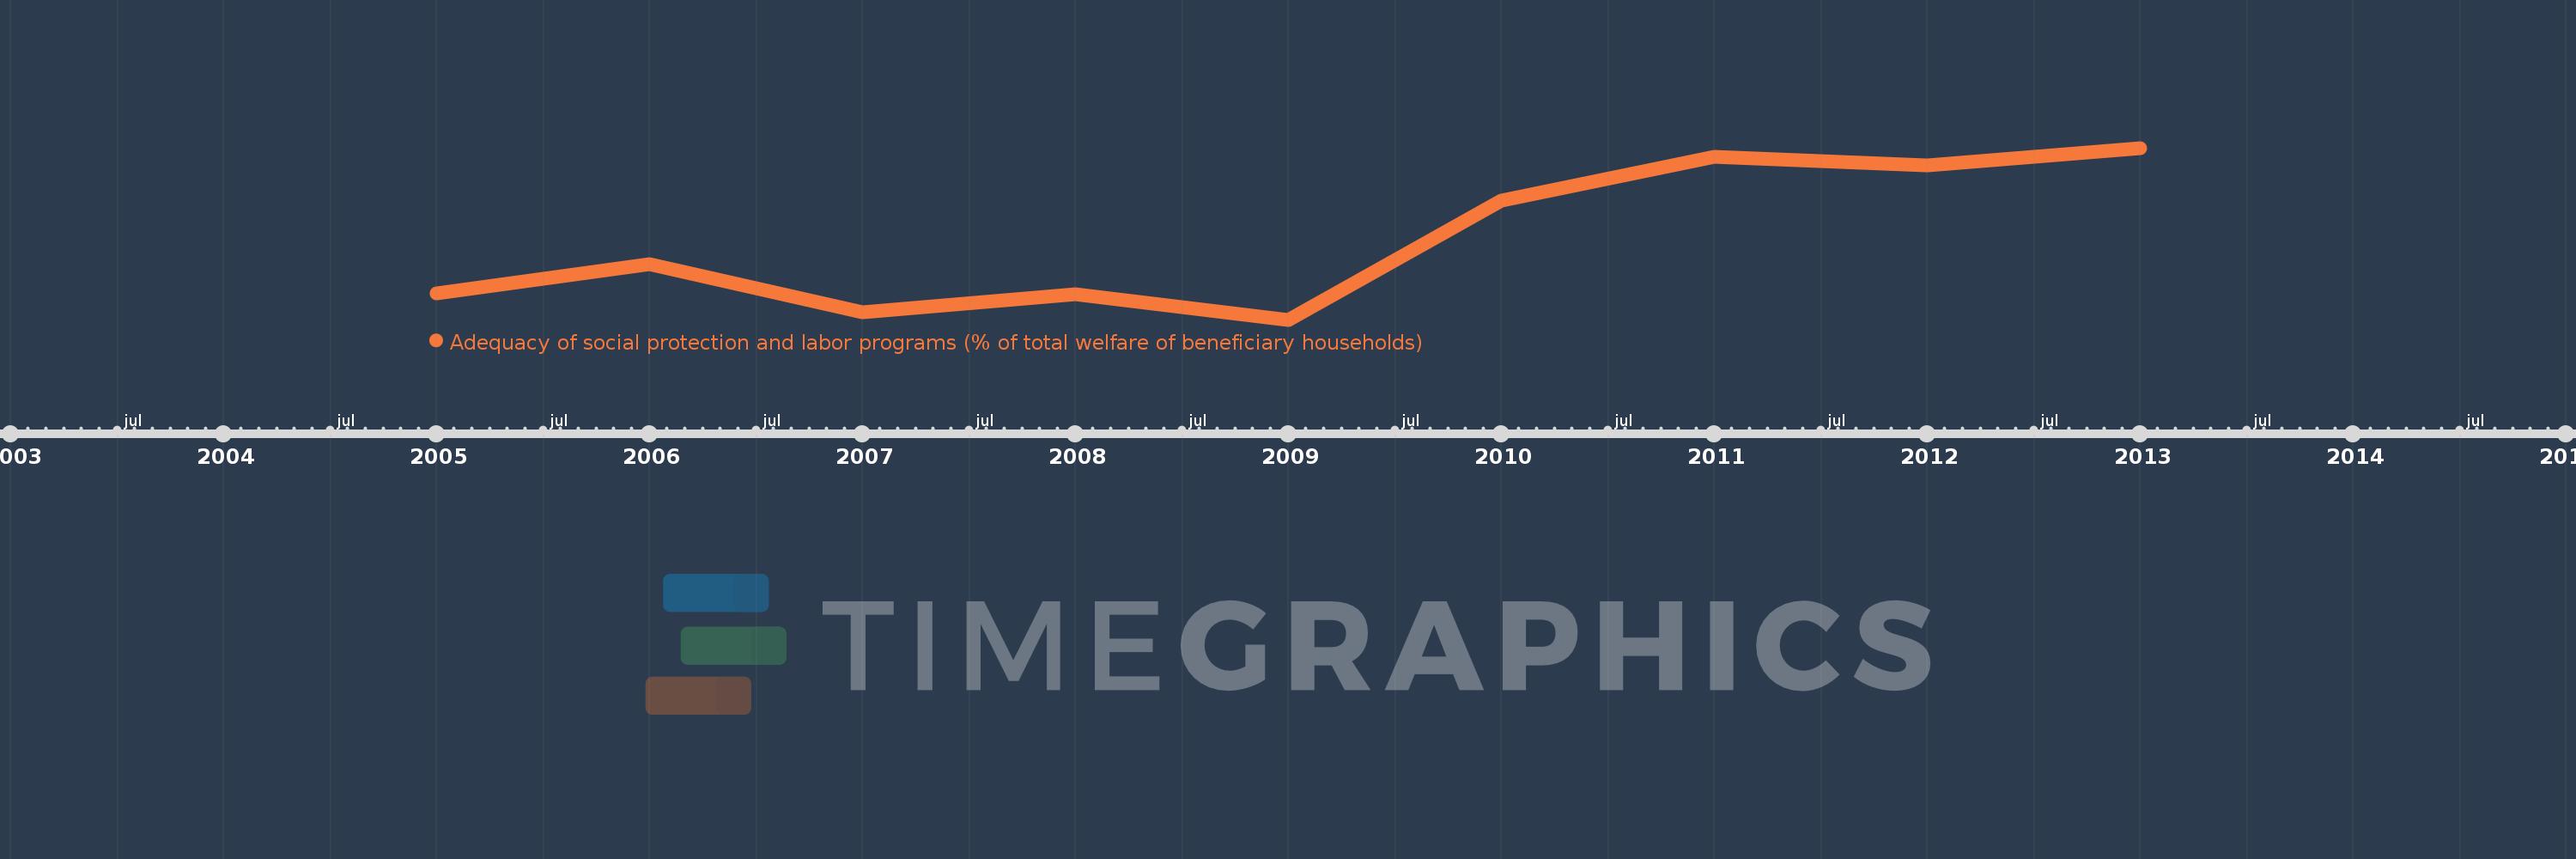
Adequacy of social protection and labor programs (% of total welfare of beneficiary households)
2013,2012,2011,2010,2009,2008,2007,2006,2005
Public Timelines
FAQ
Menu
Public Timelines
FAQ
Public Timelines
FAQ
For education
For educational institutions
For teachers
For students
Open cabinet
For educational institutions
For teachers
For students
Open cabinet
Create
Close
Create a timeline
Public timelines
Library
FAQ
Download
Global statistics library
→
Turkey
→
Adequacy of social protection and labor programs (% of total welfare of beneficiary households)
This statistics in other country:
Afghanistan
Albania
Argentina
Armenia
Azerbaijan
Bangladesh
Belarus
Belize
Benin
Bhutan
Bolivia
Bosnia and Herzegovina
Botswana
Brazil
Bulgaria
Burkina Faso
Cabo Verde
Cambodia
Cameroon
Central African Republic
Chad
Chile
Colombia
Comoros
Congo, Dem. Rep.
Congo, Rep.
Costa Rica
Cote d'Ivoire
Croatia
Djibouti
Dominica
Dominican Republic
Ecuador
Egypt, Arab Rep.
El Salvador
Fiji
Gabon
Gambia, The
Georgia
Ghana
Guatemala
Haiti
Honduras
Hungary
Iraq
Jamaica
Jordan
Kazakhstan
Kenya
Kiribati
Kosovo
Kyrgyz Republic
Lao PDR
Latvia
Liberia
Lithuania
Madagascar
Malawi
Malaysia
Maldives
Mali
Marshall Islands
Mauritania
Mauritius
Mexico
Micronesia, Fed. Sts.
Moldova
Mongolia
Montenegro
Mozambique
Nepal
Nicaragua
Niger
Nigeria
Pakistan
Palau
Panama
Papua New Guinea
Paraguay
Peru
Philippines
Poland
Romania
Russian Federation
Rwanda
Samoa
Senegal
Serbia
Sierra Leone
Slovak Republic
Solomon Islands
South Africa
South Sudan
Sri Lanka
Sudan
Swaziland
Syrian Arab Republic
Tajikistan
Tanzania
Thailand
Timor-Leste
Togo
Tonga
Tunisia
Turkey
Uganda
Ukraine
Uruguay
Vietnam
West Bank and Gaza
Yemen, Rep.
Zambia
Zimbabwe
Timeline:
This timeline shows a graph from
2005
to
2013
of Turkey. No data until
2004
. Number of actual observations by date:
9
.
Source name:
World Development Indicators
Source organization:
The Atlas of Social Protection: Indicators of Resilience and Equity (ASPIRE)
Categories, topics:
Social Protection & Labor
Last updated:
apr 23, 2017
Indicators value changes by year
Meaning:
32.62
Minimum:
28.084
jan 1, 2009
Maximum:
37.8
jan 1, 2013
At the date of observation
Value
Absolute change
Change from the previous value
jan 1, 2005
29.554
+29.554
0.0%
jan 1, 2006
31.224
+1.671
5.65%
jan 1, 2007
28.486
-2.738
-8.77%
jan 1, 2008
29.511
+1.025
3.6%
jan 1, 2009
28.084
-1.427
-4.84%
jan 1, 2010
34.806
+6.722
23.94%
jan 1, 2011
37.298
+2.492
7.16%
jan 1, 2012
36.816
-0.482
-1.29%
jan 1, 2013
37.8
+0.984
2.67%
Ranking of countries by current statistics by years
About & Feedback
Terms
Privacy
Library
2024
©
Time.Graphics
Support 24/7
Cabinet
Get premium
Donate
The service accepts bank transfer (ACH, Wire) or cards (Visa, MasterCard, etc). Processed by Stripe.
Secured with SSL
Excellent (Trustpilot Reviews)
Based on 115+ reviews
Write your own review on
Trustpilot.com
