29
/
en
AIzaSyAYiBZKx7MnpbEhh9jyipgxe19OcubqV5w
April 1, 2024
262391
Thailand
THA
true
2
1
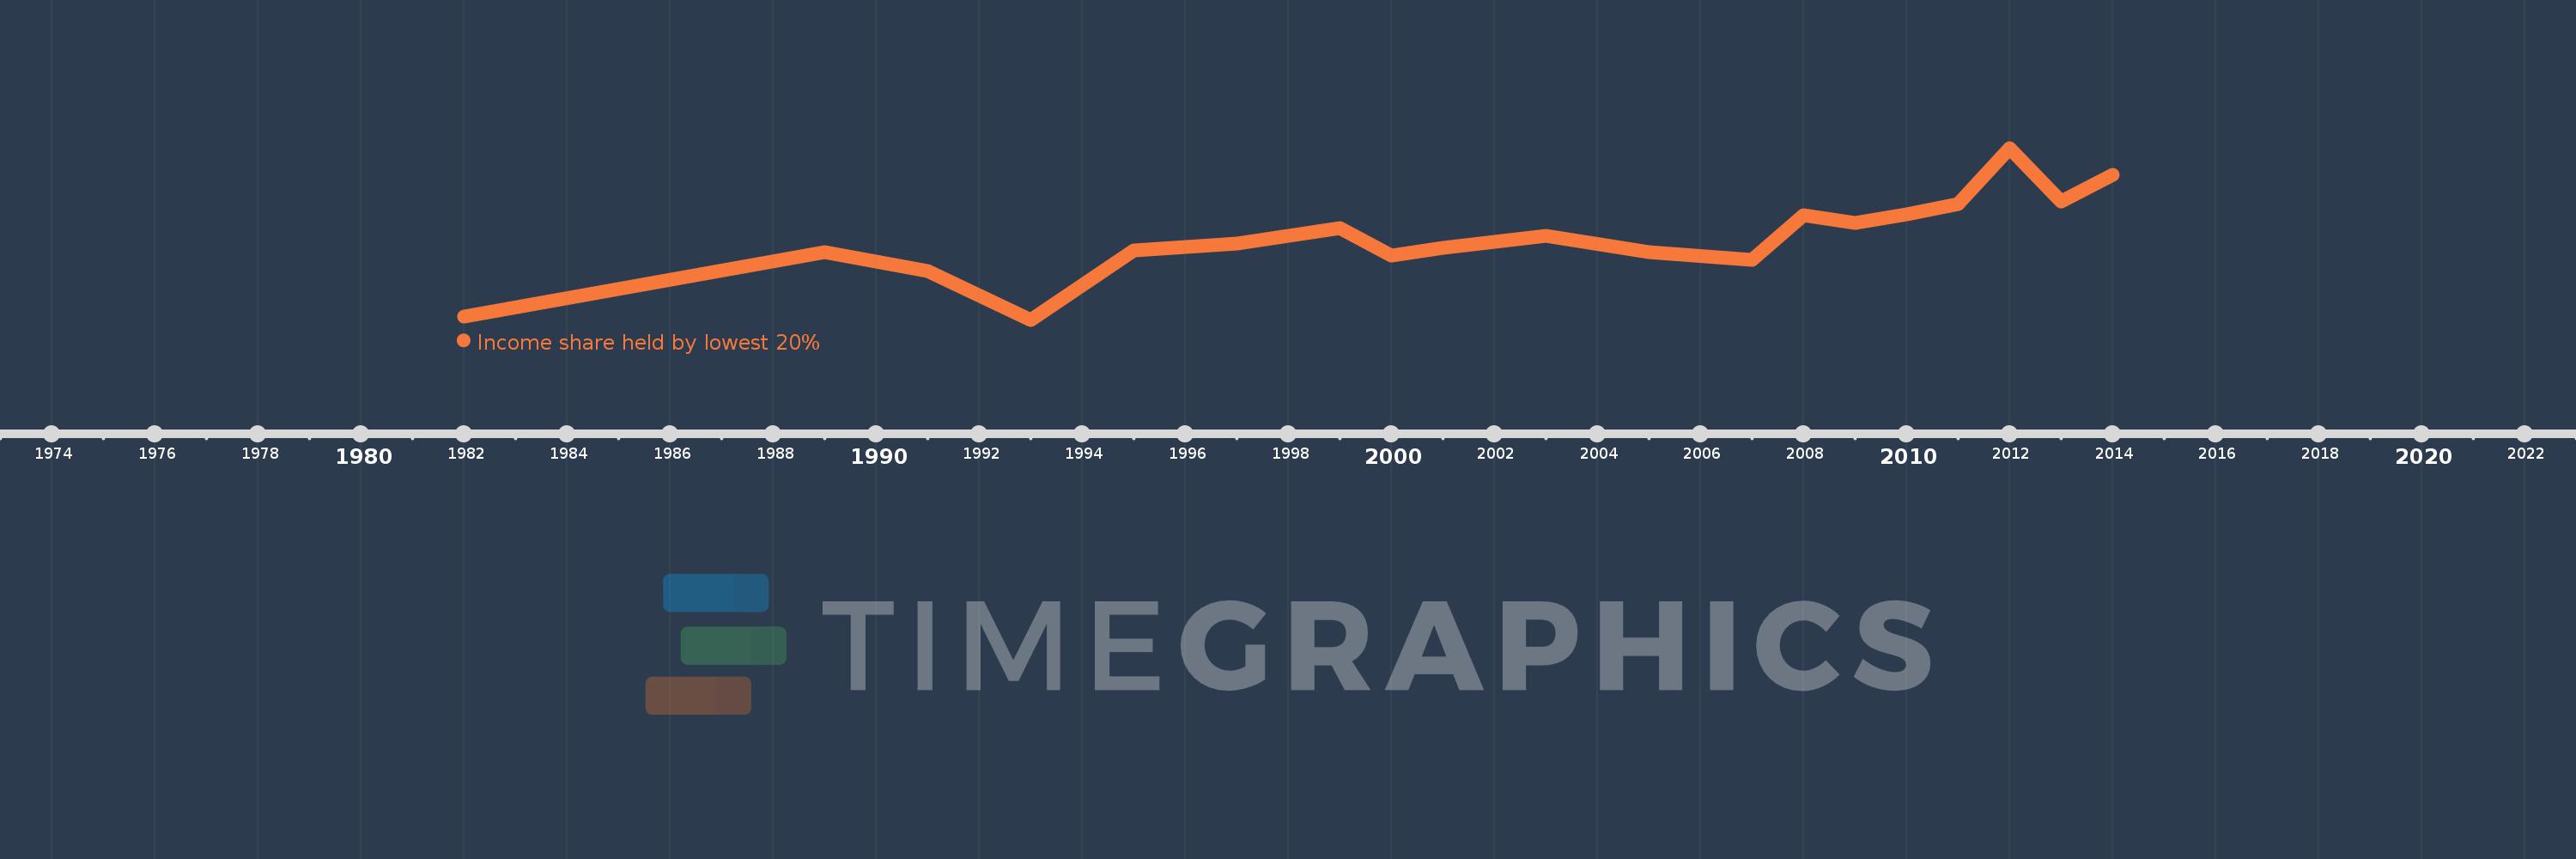
Income share held by lowest 20%
2014,2013,2012,2011,2010,2009,2008,2007,2005,2003,2001,2000,1999,1997,1995,1993,1991,1989,1982
This statistics in other country:
Timeline:
This timeline shows a graph from 1982 to 2014 of Thailand. No data until 1981. Number of actual observations by date: 19.
Source name:
World Development Indicators
Source organization:
World Bank, Development Research Group. Data are based on primary household survey data obtained from government statistical agencies and World Bank country departments. Data for high-income economies are from the Luxembourg Income Study database. For more information and methodology, please see PovcalNet (http://iresearch.worldbank.org/PovcalNet/index.htm).
Categories, topics:
Poverty, Aid Effectiveness
Last updated:
apr 23, 2017
Indicators value changes by year
At the date of observation
Value
Absolute change
Change from previous value
jan 1, 1982
5.42
+5.42
0.0%
jan 1, 1989
6.11
+0.69
12.73%
jan 1, 1991
5.91
-0.2
-3.27%
jan 1, 1993
5.39
-0.52
-8.8%
jan 1, 1995
6.13
+0.74
13.73%
jan 1, 1997
6.2
+0.07
1.14%
jan 1, 1999
6.37
+0.17
2.74%
jan 1, 2000
6.07
-0.3
-4.71%
jan 1, 2001
6.16
+0.09
1.48%
jan 1, 2003
6.28
+0.12
1.95%
jan 1, 2005
6.11
-0.17
-2.71%
jan 1, 2007
6.03
-0.08
-1.31%
jan 1, 2008
6.5
+0.47
7.79%
jan 1, 2009
6.42
-0.08
-1.23%
jan 1, 2010
6.51
+0.09
1.4%
jan 1, 2011
6.62
+0.11
1.69%
jan 1, 2012
7.22
+0.6
9.06%
jan 1, 2013
6.65
-0.57
-7.89%
jan 1, 2014
6.93
+0.28
4.21%
Ranking of countries by current statistics by years


Comments: