30
/
AIzaSyAYiBZKx7MnpbEhh9jyipgxe19OcubqV5w
April 1, 2024
260115
Tajikistan
TJK
true
2
1
PPG, multilateral concessional (DIS, current US$)
2016,2015,2014,2013,2012,2011,2010,2009,2008,2007,2006,2005,2004,2003,2002,2001,2000,1999,1998,1997
Public Timelines
FAQ
Menu
Public Timelines
FAQ
Public Timelines
FAQ
For education
For educational institutions
For teachers
For students
Open cabinet
For educational institutions
For teachers
For students
Open cabinet
Create
Close
Create a timeline
Public timelines
Library
FAQ
Download
Global statistics library
→
Tajikistan
→
PPG, multilateral concessional (DIS, current US$)
This statistics in other country:
Afghanistan
Albania
Algeria
Angola
Argentina
Armenia
Azerbaijan
Bangladesh
Belarus
Belize
Benin
Bhutan
Bolivia
Bosnia and Herzegovina
Botswana
Brazil
Bulgaria
Burkina Faso
Burundi
Cabo Verde
Cambodia
Cameroon
Central African Republic
Chad
China
Colombia
Comoros
Congo, Dem. Rep.
Congo, Rep.
Costa Rica
Cote d'Ivoire
Djibouti
Dominica
Dominican Republic
East Asia & Pacific (excluding high income)
Ecuador
Egypt, Arab Rep.
El Salvador
Eritrea
Ethiopia
Europe & Central Asia (excluding high income)
Fiji
Gabon
Gambia, The
Georgia
Ghana
Grenada
Guatemala
Guinea
Guinea-Bissau
Guyana
Haiti
Honduras
IDA only
India
Indonesia
Iran, Islamic Rep.
Jamaica
Jordan
Kazakhstan
Kenya
Kosovo
Kyrgyz Republic
Lao PDR
Latin America & Caribbean (excluding high income)
Lebanon
Lesotho
Liberia
Low & middle income
Low income
Lower middle income
Macedonia, FYR
Madagascar
Malawi
Malaysia
Maldives
Mali
Mauritania
Mauritius
Mexico
Middle East & North Africa (excluding high income)
Middle income
Moldova
Mongolia
Montenegro
Morocco
Mozambique
Myanmar
Nepal
Nicaragua
Niger
Nigeria
Pakistan
Panama
Papua New Guinea
Paraguay
Peru
Philippines
Romania
Russian Federation
Rwanda
Samoa
Sao Tome and Principe
Senegal
Serbia
Sierra Leone
Solomon Islands
Somalia
South Asia
Sri Lanka
St. Lucia
St. Vincent and the Grenadines
Sub-Saharan Africa (excluding high income)
Sudan
Swaziland
Syrian Arab Republic
Tajikistan
Tanzania
Thailand
Togo
Tonga
Tunisia
Turkey
Uganda
Ukraine
Upper middle income
Uzbekistan
Vanuatu
Venezuela, RB
Vietnam
Yemen, Rep.
Zambia
Zimbabwe
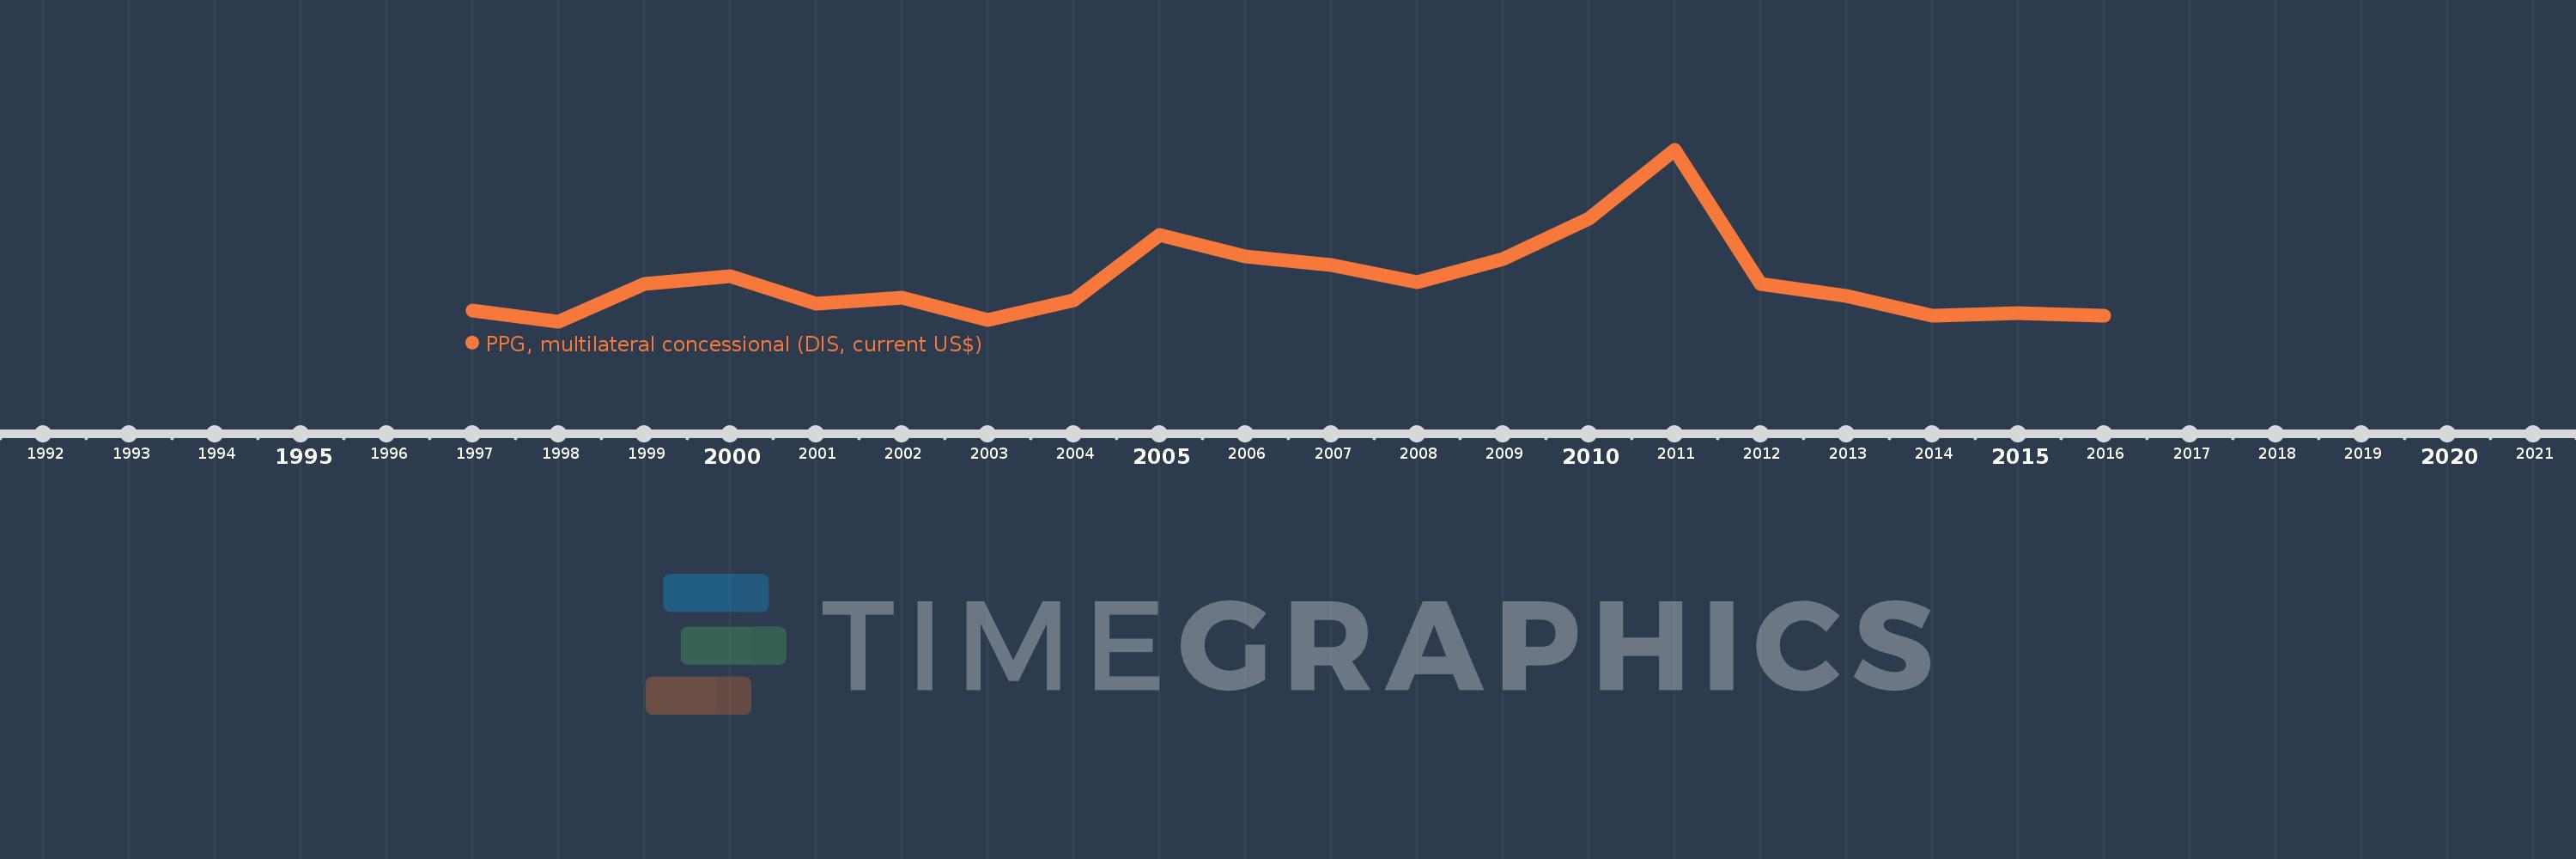
Timeline:
This timeline shows a graph from
1997
to
2016
of Tajikistan. No data until
1996
. Number of actual observations by date:
20
.
Source name:
World Development Indicators
Source organization:
World Bank, International Debt Statistics.
Categories, topics:
External Debt
Last updated:
apr 23, 2017
Indicators value changes by year
Meaning:
52.208 mln
Minimum:
21.984 mln
jan 1, 1998
Maximum:
146.434 mln
jan 1, 2011
At the date of observation
Value
Absolute change
Change from the previous value
jan 1, 1997
30.41 mln
+30.41 mln
0.0%
jan 1, 1998
21.984 mln
-8.426 mln
-27.71%
jan 1, 1999
49.718 mln
+27.734 mln
126.16%
jan 1, 2000
55.225 mln
+5.507 mln
11.08%
jan 1, 2001
35.094 mln
-20.131 mln
-36.45%
jan 1, 2002
39.495 mln
+4.401 mln
12.54%
jan 1, 2003
23.706 mln
-15.789 mln
-39.98%
jan 1, 2004
37.465 mln
+13.759 mln
58.04%
jan 1, 2005
85.117 mln
+47.652 mln
127.19%
jan 1, 2006
69.231 mln
-15.886 mln
-18.66%
jan 1, 2007
63.031 mln
-6.2 mln
-8.96%
jan 1, 2008
50.655 mln
-12.376 mln
-19.63%
jan 1, 2009
67.744 mln
+17.089 mln
33.74%
jan 1, 2010
96.666 mln
+28.922 mln
42.69%
jan 1, 2011
146.434 mln
+49.768 mln
51.48%
jan 1, 2012
49.498 mln
-96.936 mln
-66.2%
jan 1, 2013
40.705 mln
-8.793 mln
-17.76%
jan 1, 2014
26.567 mln
-14.138 mln
-34.73%
jan 1, 2015
28.614 mln
+2.047 mln
7.71%
jan 1, 2016
26.806 mln
-1.808 mln
-6.32%
Ranking of countries by current statistics by years
About & Feedback
Terms
Privacy
Library
2024
©
Time.Graphics
Support 24/7
Cabinet
Get premium
Donate
The service accepts bank transfer (ACH, Wire) or cards (Visa, MasterCard, etc). Processed by Stripe.
Secured with SSL
Excellent (Trustpilot Reviews)
Based on 115+ reviews
Write your own review on
Trustpilot.com
