30
/
AIzaSyAYiBZKx7MnpbEhh9jyipgxe19OcubqV5w
April 1, 2024
260105
Tajikistan
TJK
true
2
1
PPG, IDA (DOD, current US$)
2016,2015,2014,2013,2012,2011,2010,2009,2008,2007,2006,2005,2004,2003,2002,2001,2000,1999,1998,1997
Public Timelines
FAQ
Menu
Public Timelines
FAQ
For education
For educational institutions
For teachers
For students
Open cabinet
Create
Close
Create a timeline
Public timelines
Library
FAQ
Download
Global statistics library
→
Tajikistan
→
PPG, IDA (DOD, current US$)
This statistics in other country:
Afghanistan
Albania
Angola
Armenia
Azerbaijan
Bangladesh
Benin
Bhutan
Bolivia
Bosnia and Herzegovina
Botswana
Burkina Faso
Burundi
Cabo Verde
Cambodia
Cameroon
Central African Republic
Chad
China
Colombia
Comoros
Congo, Dem. Rep.
Congo, Rep.
Costa Rica
Cote d'Ivoire
Djibouti
Dominica
Dominican Republic
East Asia & Pacific (excluding high income)
Ecuador
Egypt, Arab Rep.
El Salvador
Eritrea
Ethiopia
Europe & Central Asia (excluding high income)
Gambia, The
Georgia
Ghana
Grenada
Guinea
Guinea-Bissau
Guyana
Haiti
Honduras
IDA only
India
Indonesia
Jordan
Kenya
Kosovo
Kyrgyz Republic
Lao PDR
Latin America & Caribbean (excluding high income)
Lesotho
Liberia
Low & middle income
Low income
Lower middle income
Macedonia, FYR
Madagascar
Malawi
Maldives
Mali
Mauritania
Mauritius
Middle East & North Africa (excluding high income)
Middle income
Moldova
Mongolia
Montenegro
Morocco
Mozambique
Myanmar
Nepal
Nicaragua
Niger
Nigeria
Pakistan
Papua New Guinea
Paraguay
Philippines
Rwanda
Samoa
Sao Tome and Principe
Senegal
Serbia
Sierra Leone
Solomon Islands
Somalia
South Africa
South Asia
Sri Lanka
St. Lucia
St. Vincent and the Grenadines
Sub-Saharan Africa (excluding high income)
Sudan
Swaziland
Syrian Arab Republic
Tajikistan
Tanzania
Thailand
Togo
Tonga
Tunisia
Turkey
Uganda
Upper middle income
Uzbekistan
Vanuatu
Vietnam
Yemen, Rep.
Zambia
Zimbabwe
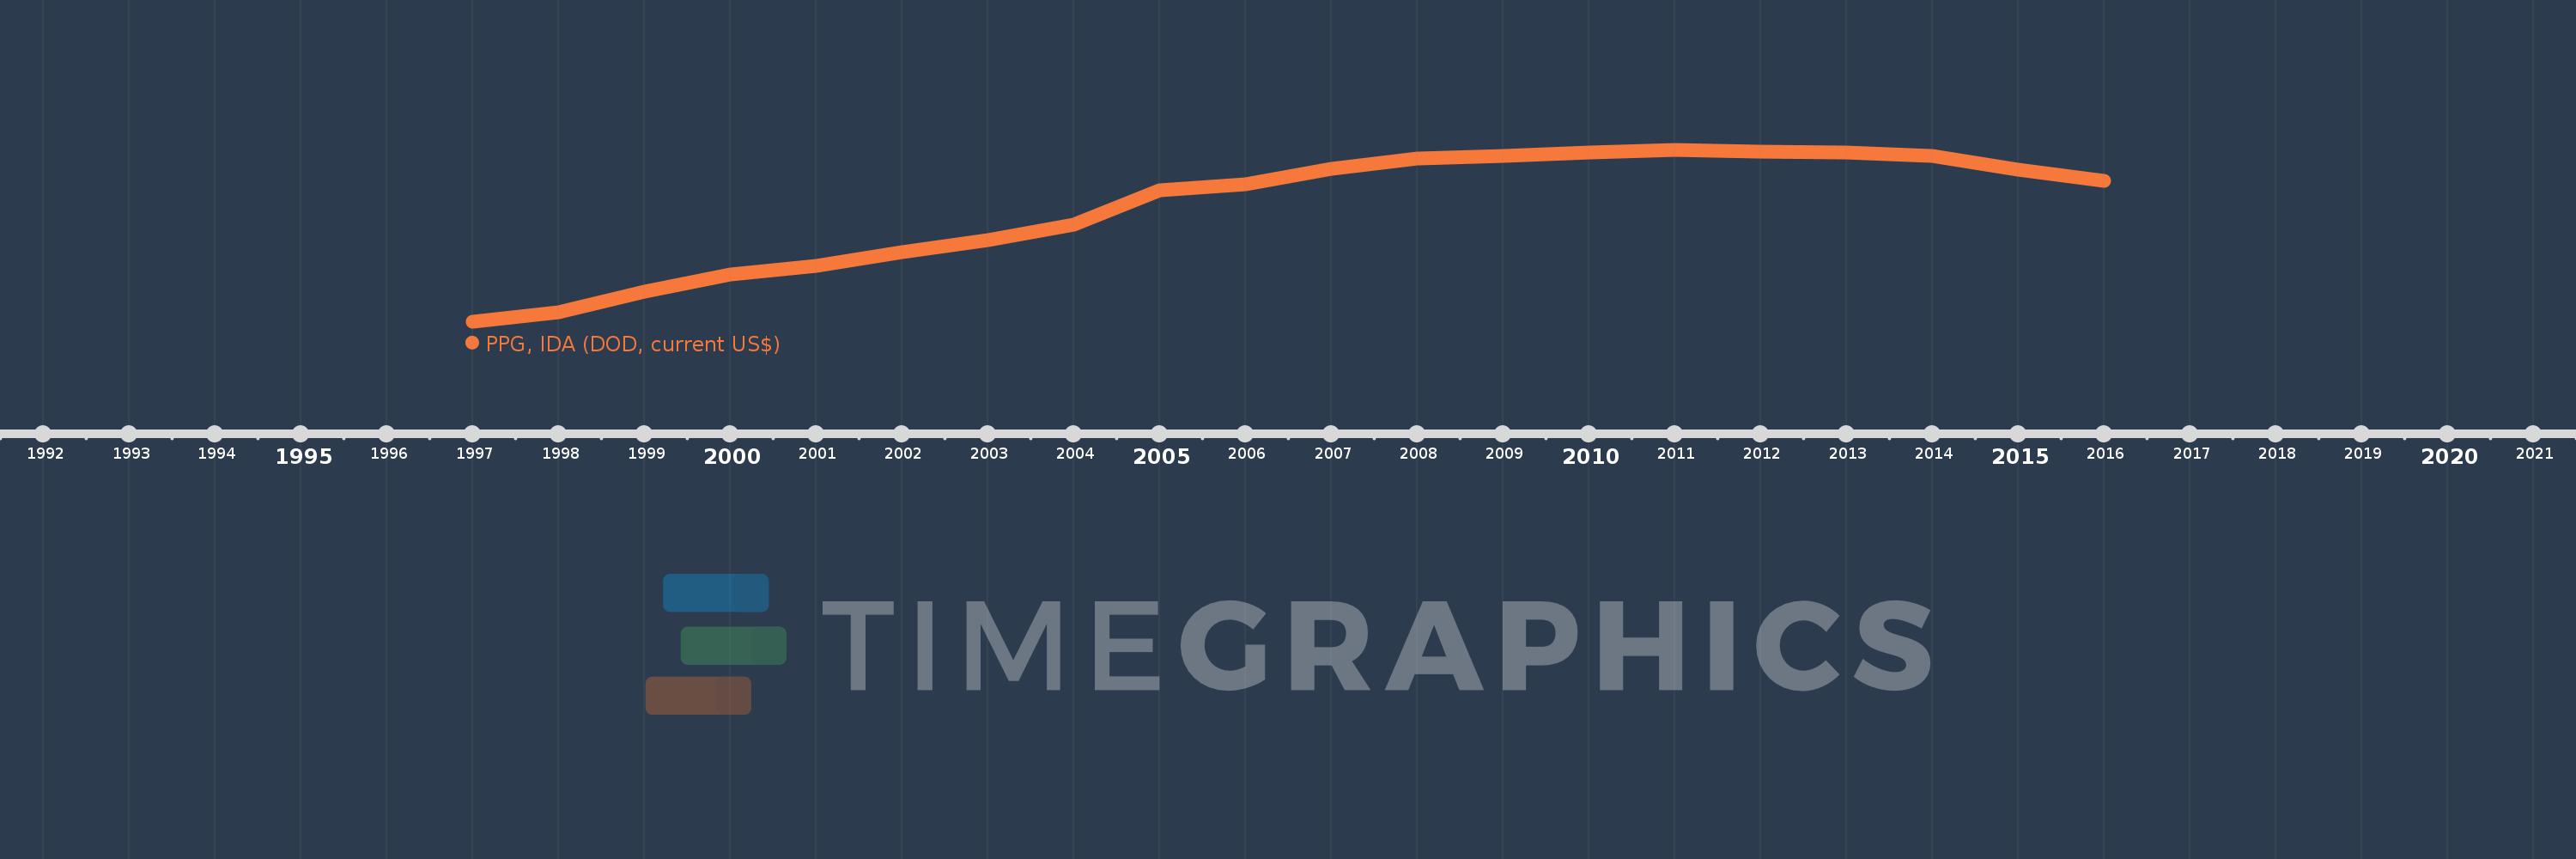
Timeline:
This timeline shows a graph from
1997
to
2016
of Tajikistan. No data until
1996
. Number of actual observations by date:
20
.
Source name:
World Development Indicators
Source organization:
World Bank, International Debt Statistics.
Categories, topics:
External Debt
Last updated:
apr 23, 2017
Indicators value changes by year
Meaning:
260.874 mln
Minimum:
30.212 mln
jan 1, 1997
Maximum:
377.048 mln
jan 1, 2011
At the date of observation
Value
Absolute change
Change from the previous value
jan 1, 1997
30.212 mln
+30.212 mln
0.0%
jan 1, 1998
50.102 mln
+19.89 mln
65.83%
jan 1, 1999
91.824 mln
+41.722 mln
83.27%
jan 1, 2000
126.049 mln
+34.225 mln
37.27%
jan 1, 2001
142.62 mln
+16.571 mln
13.15%
jan 1, 2002
171.646 mln
+29.026 mln
20.35%
jan 1, 2003
194.982 mln
+23.336 mln
13.6%
jan 1, 2004
227.543 mln
+32.561 mln
16.7%
jan 1, 2005
295.673 mln
+68.13 mln
29.94%
jan 1, 2006
307.705 mln
+12.032 mln
4.07%
jan 1, 2007
339.036 mln
+31.331 mln
10.18%
jan 1, 2008
360.495 mln
+21.459 mln
6.33%
jan 1, 2009
365.247 mln
+4.752 mln
1.32%
jan 1, 2010
372.831 mln
+7.584 mln
2.08%
jan 1, 2011
377.048 mln
+4.217 mln
1.13%
jan 1, 2012
374.205 mln
-2.843 mln
-0.75%
jan 1, 2013
371.701 mln
-2.504 mln
-0.67%
jan 1, 2014
365.584 mln
-6.117 mln
-1.65%
jan 1, 2015
337.163 mln
-28.421 mln
-7.77%
jan 1, 2016
315.822 mln
-21.341 mln
-6.33%
Ranking of countries by current statistics by years
About & Feedback
Terms
Privacy
Library
2024
©
Time.Graphics
Support 24/7
Cabinet
Get premium
Donate
The service accepts bank transfer (ACH, Wire) or cards (Visa, MasterCard, etc). Processed by Stripe.
Secured with SSL
Excellent (Trustpilot Reviews)
Based on 115+ reviews
Write your own review on
Trustpilot.com
