30
/
AIzaSyAYiBZKx7MnpbEhh9jyipgxe19OcubqV5w
April 1, 2024
25832
Central Europe and the Baltics
CEB
false
2
1
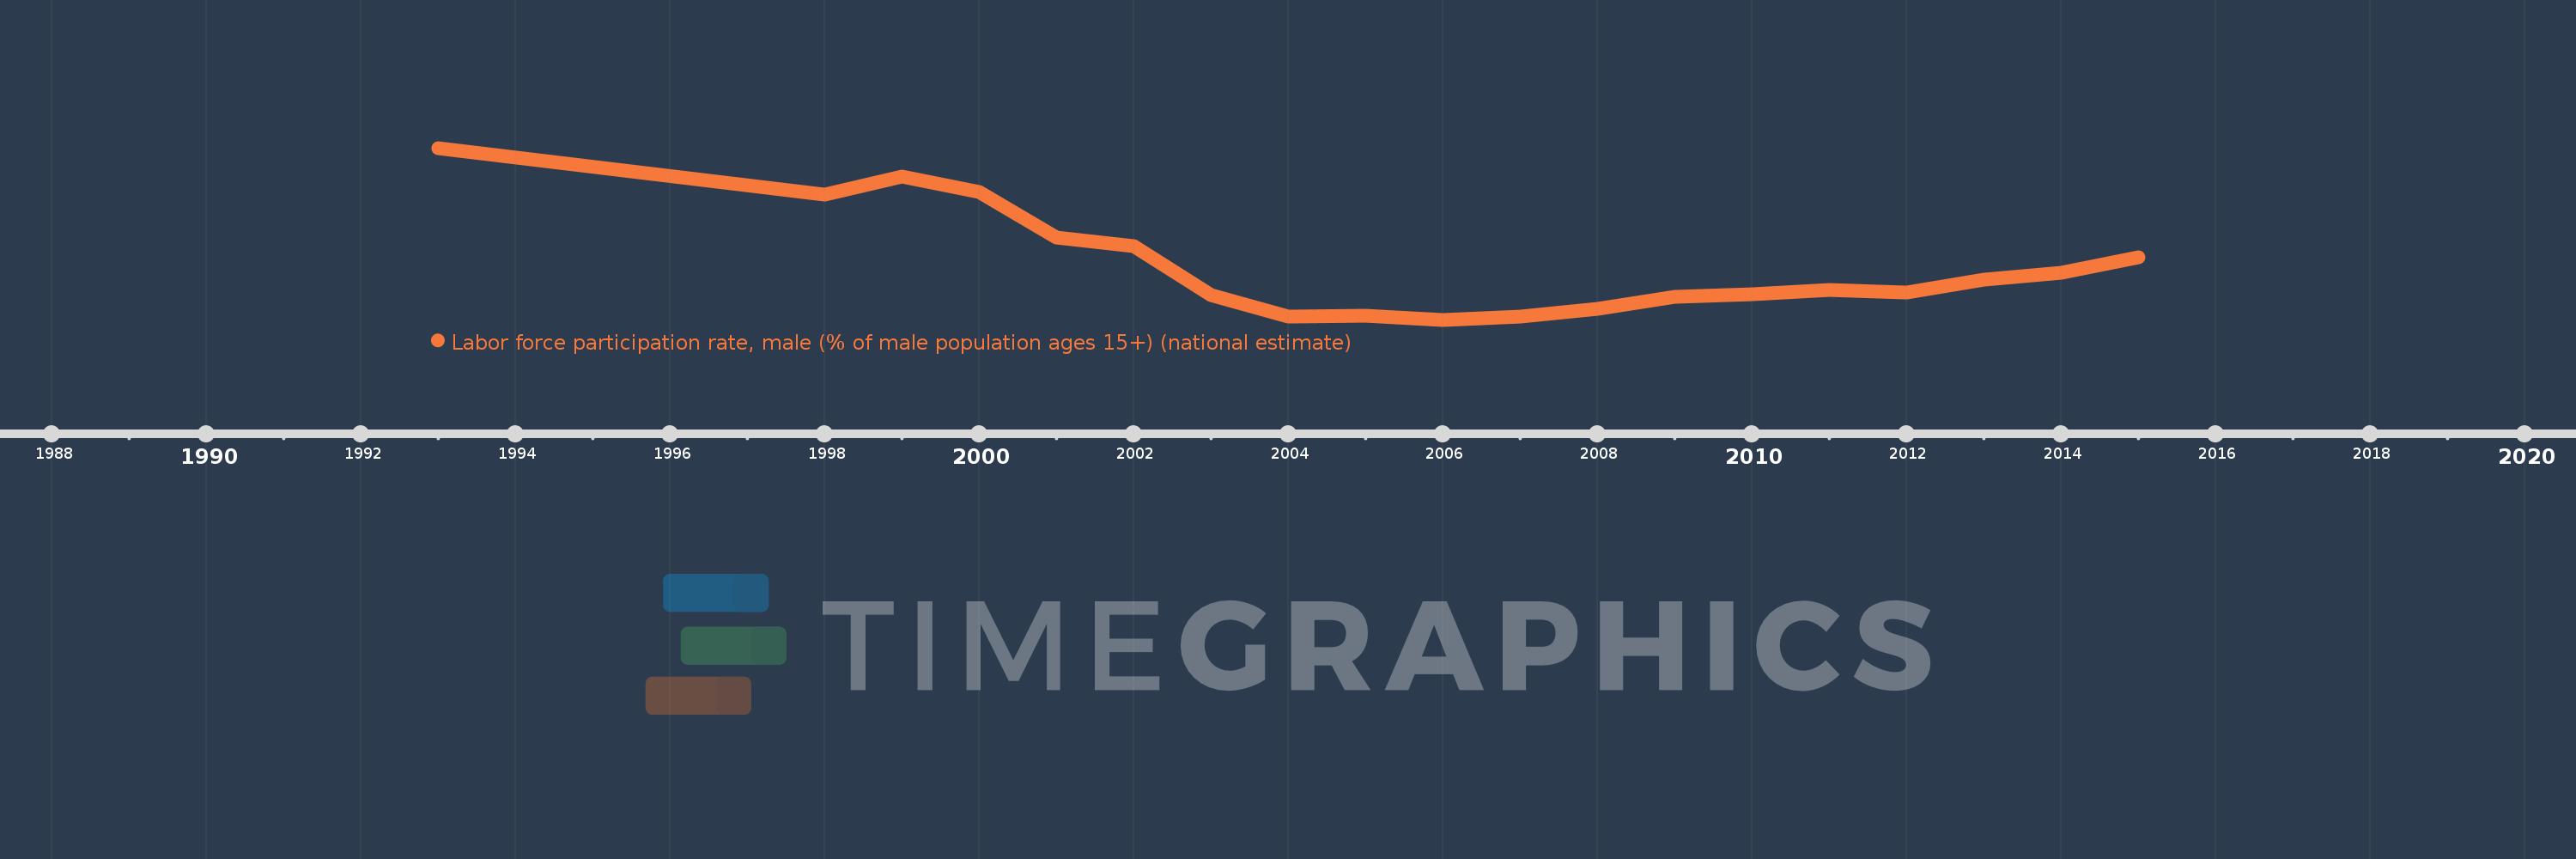
Labor force participation rate, male (% of male population ages 15+) (national estimate)
2015,2014,2013,2012,2011,2010,2009,2008,2007,2006,2005,2004,2003,2002,2001,2000,1999,1998,1993
