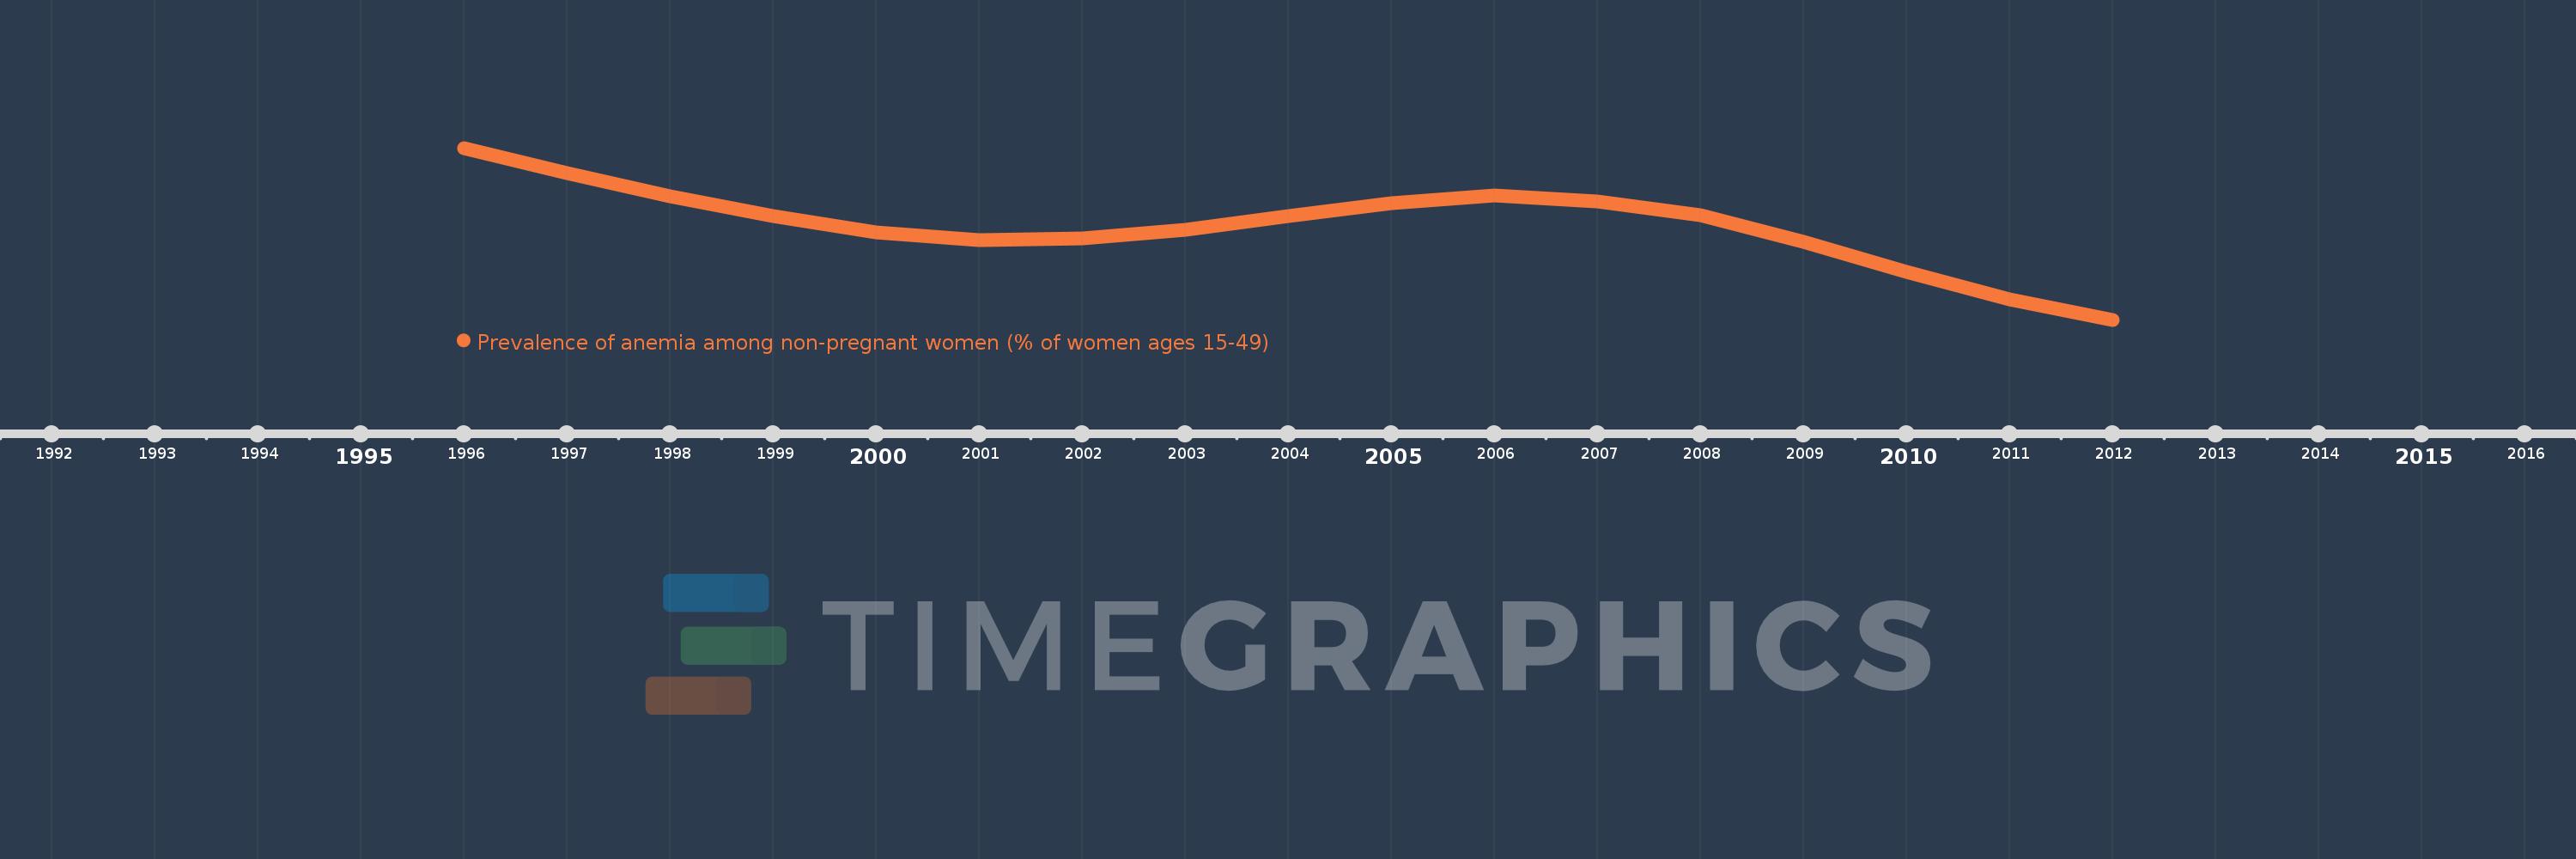
This timeline shows a graph from 1996 to 2012 of Arab World. No data until 1995. Number of actual observations by date: 17.
Source name:
World Development Indicators
Source organization:
Stevens GA, Finucane MM, De-Regil LM, et al. Global, regional, and national trends in hemoglobin concentration and prevalence of total and severe anemia in children and pregnant and non-pregnant women for 1995-2011: a systematic analysis of population-representative data. The Lancet Global Health 2013; 1(1): e16-e25.
Categories, topics:
Health
Last updated:
apr 23, 2017
Indicators value changes by year
Meaning:
36.397
Minimum:
33.427
jan 1, 2012
Maximum:
38.851
jan 1, 1996
At the date of observation
Value
Absolute change
Change from the previous value
jan 1, 1996
38.851
+38.851
0.0%
jan 1, 1997
38.068
-0.783
-2.02%
jan 1, 1998
37.33
-0.738
-1.94%
jan 1, 1999
36.697
-0.634
-1.7%
jan 1, 2000
36.192
-0.504
-1.37%
jan 1, 2001
35.953
-0.24
-0.66%
jan 1, 2002
35.996
+0.043
0.12%
jan 1, 2003
36.278
+0.282
0.78%
jan 1, 2004
36.7
+0.422
1.16%
jan 1, 2005
37.098
+0.399
1.09%
jan 1, 2006
37.344
+0.246
0.66%
jan 1, 2007
37.173
-0.171
-0.46%
jan 1, 2008
36.718
-0.455
-1.22%
jan 1, 2009
35.896
-0.822
-2.24%
jan 1, 2010
34.949
-0.947
-2.64%
jan 1, 2011
34.075
-0.874
-2.5%
jan 1, 2012
33.427
-0.648
-1.9%
Ranking of countries by current statistics by years
