29
/
en
AIzaSyAYiBZKx7MnpbEhh9jyipgxe19OcubqV5w
April 1, 2024
239371
Sierra Leone
SLE
true
2
1
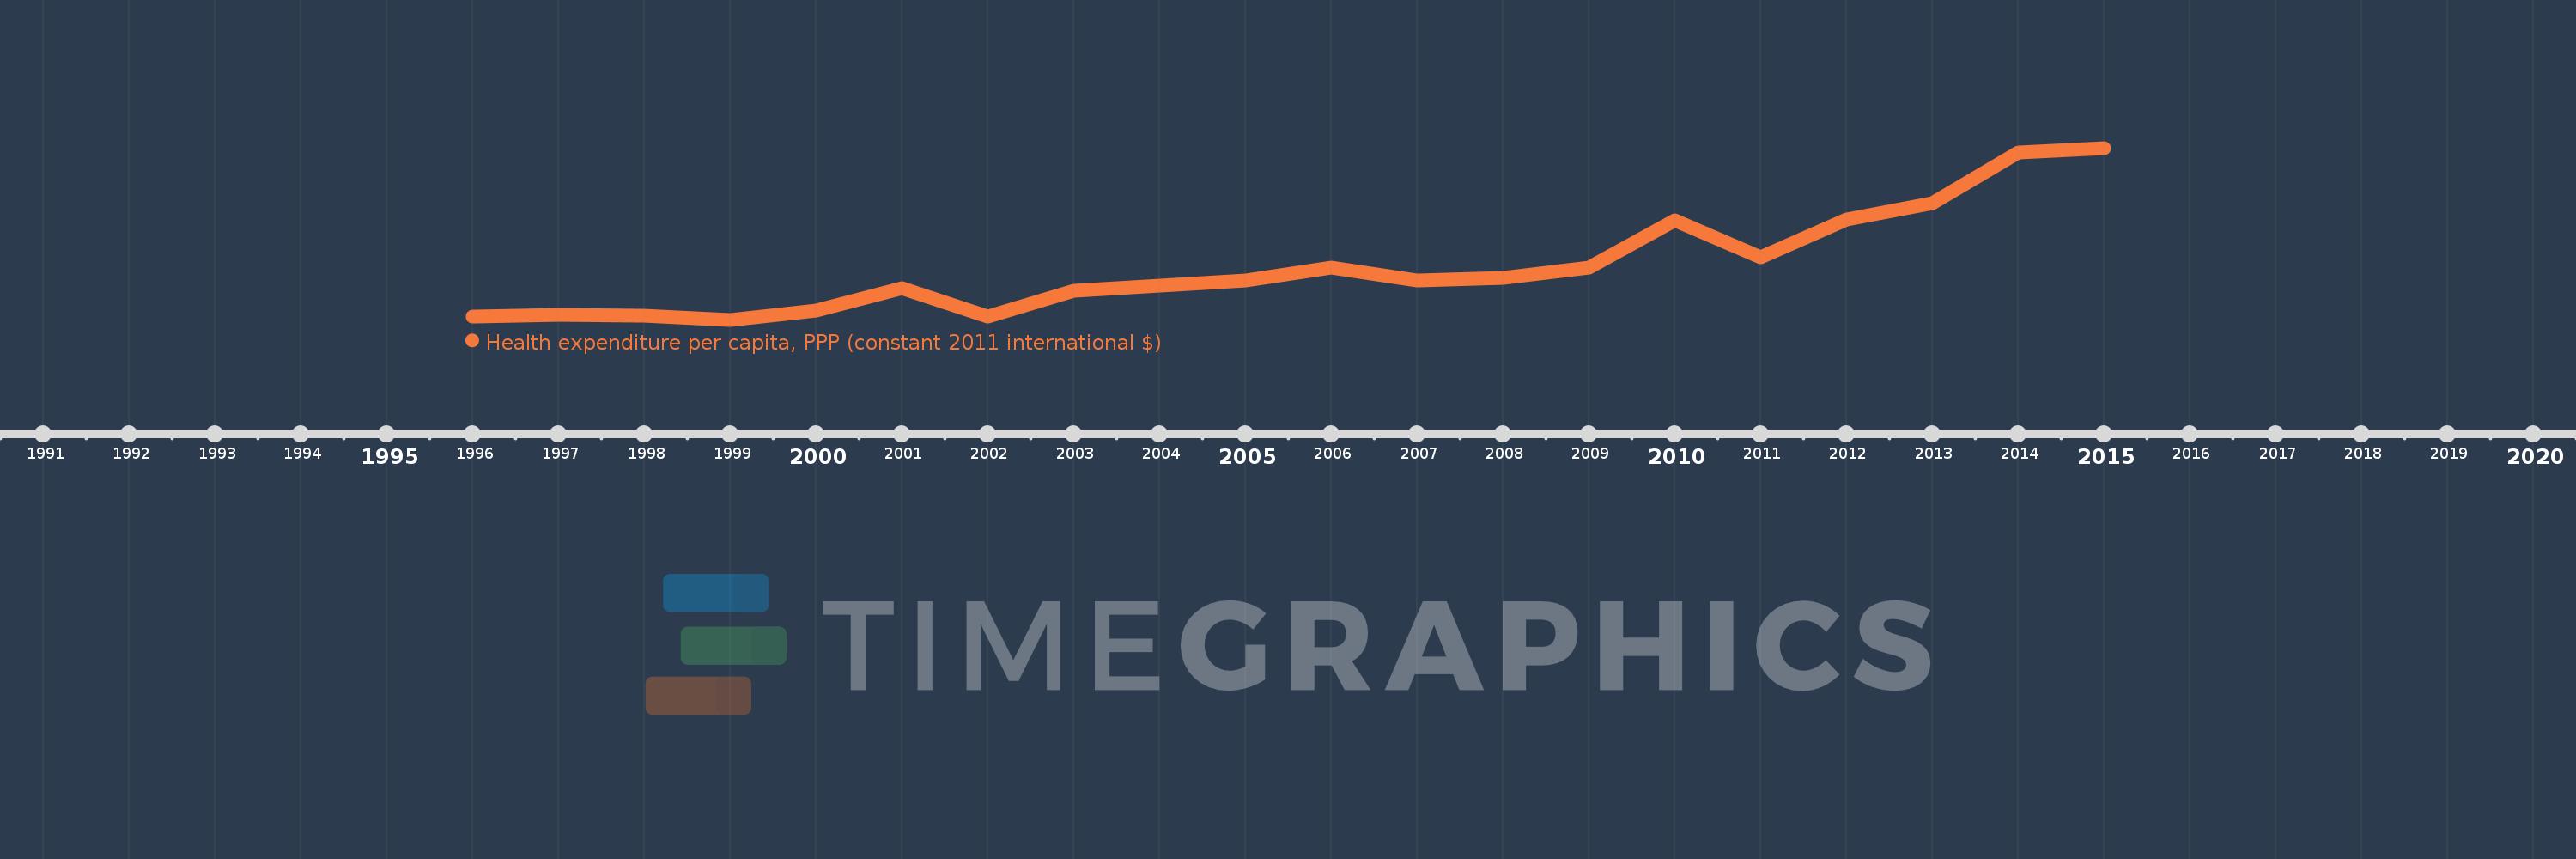
Health expenditure per capita, PPP (constant 2011 international $)
2015,2014,2013,2012,2011,2010,2009,2008,2007,2006,2005,2004,2003,2002,2001,2000,1999,1998,1997,1996
This statistics in other country:
AfghanistanAlbaniaAlgeriaAndorraAngolaAntigua and BarbudaArab WorldArgentinaArmeniaAustraliaAustriaAzerbaijanBahamas, TheBahrainBangladeshBarbadosBelarusBelgiumBelizeBeninBhutanBoliviaBosnia and HerzegovinaBotswanaBrazilBrunei DarussalamBulgariaBurkina FasoBurundiCabo VerdeCambodiaCameroonCanadaCaribbean small statesCentral African RepublicCentral Europe and the BalticsChadChileChinaColombiaComorosCongo, Dem. Rep.Congo, Rep.Costa RicaCote d'IvoireCroatiaCubaCyprusCzech RepublicDenmarkDjiboutiDominicaDominican RepublicEarly-demographic dividendEast Asia & PacificEast Asia & Pacific (excluding high income)East Asia & Pacific (IDA & IBRD countries)EcuadorEgypt, Arab Rep.El SalvadorEquatorial GuineaEritreaEstoniaEthiopiaEuro areaEurope & Central AsiaEurope & Central Asia (excluding high income)Europe & Central Asia (IDA & IBRD countries)European UnionFijiFinlandFragile and conflict affected situationsFranceGabonGambia, TheGeorgiaGermanyGhanaGreeceGrenadaGuatemalaGuineaGuinea-BissauGuyanaHaitiHeavily indebted poor countries (HIPC)High incomeHondurasHungaryIBRD onlyIcelandIDA & IBRD totalIDA blendIDA onlyIDA totalIndiaIndonesiaIran, Islamic Rep.IraqIrelandIsraelItalyJamaicaJapanJordanKazakhstanKenyaKiribatiKorea, Rep.KuwaitKyrgyz RepublicLao PDRLate-demographic dividendLatin America & Caribbean Latin America & Caribbean (excluding high income)Latin America & the Caribbean (IDA & IBRD countries)LatviaLeast developed countries: UN classificationLebanonLesothoLiberiaLibyaLithuaniaLow & middle incomeLow incomeLower middle incomeLuxembourgMacedonia, FYRMadagascarMalawiMalaysiaMaldivesMaliMaltaMarshall IslandsMauritaniaMauritiusMexicoMicronesia, Fed. Sts.Middle East & North AfricaMiddle East & North Africa (excluding high income)Middle East & North Africa (IDA & IBRD countries)Middle incomeMoldovaMonacoMongoliaMontenegroMoroccoMozambiqueMyanmarNamibiaNauruNepalNetherlandsNew ZealandNicaraguaNigerNigeriaNorth AmericaNorwayOECD membersOmanOther small statesPacific island small statesPakistanPalauPanamaPapua New GuineaParaguayPeruPhilippinesPolandPortugalPost-demographic dividendPre-demographic dividendQatarRomaniaRussian FederationRwandaSamoaSan MarinoSao Tome and PrincipeSaudi ArabiaSenegalSerbiaSeychellesSierra LeoneSingaporeSlovak RepublicSloveniaSmall statesSolomon IslandsSouth AfricaSouth AsiaSouth Asia (IDA & IBRD)South SudanSpainSri LankaSt. Kitts and NevisSt. LuciaSt. Vincent and the GrenadinesSub-Saharan Africa Sub-Saharan Africa (excluding high income)Sub-Saharan Africa (IDA & IBRD countries)SudanSurinameSwazilandSwedenSwitzerlandSyrian Arab RepublicTajikistanTanzaniaThailandTimor-LesteTogoTongaTrinidad and TobagoTunisiaTurkeyTurkmenistanTuvaluUgandaUkraineUnited Arab EmiratesUnited KingdomUnited StatesUpper middle incomeUruguayUzbekistanVanuatuVenezuela, RBVietnamWorldYemen, Rep.ZambiaZimbabwe Timeline:
This timeline shows a graph from 1996 to 2015 of Sierra Leone. No data until 1995. Number of actual observations by date: 20.
Source name:
World Development Indicators
Source organization:
World Health Organization Global Health Expenditure database (see http://apps.who.int/nha/database for the most recent updates).
Categories, topics:
Health
Last updated:
apr 23, 2017
Indicators value changes by year
Minimum:
85.639
jan 1, 1999
Maximum:
223.744
jan 1, 2015
At the date of observation
Value
Absolute change
Change from previous value
jan 1, 1996
88.163
+88.163
0.0%
jan 1, 1997
89.265
+1.102
1.25%
jan 1, 1998
89.166
-0.099
-0.11%
jan 1, 1999
85.639
-3.527
-3.96%
jan 1, 2000
93.191
+7.552
8.82%
jan 1, 2001
110.833
+17.642
18.93%
jan 1, 2002
87.928
-22.905
-20.67%
jan 1, 2003
108.726
+20.798
23.65%
jan 1, 2004
112.826
+4.1
3.77%
jan 1, 2005
117.427
+4.601
4.08%
jan 1, 2006
127.53
+10.104
8.6%
jan 1, 2007
116.976
-10.554
-8.28%
jan 1, 2008
119.576
+2.6
2.22%
jan 1, 2009
127.64
+8.063
6.74%
jan 1, 2010
165.591
+37.952
29.73%
jan 1, 2011
135.643
-29.948
-18.09%
jan 1, 2012
166.535
+30.892
22.77%
jan 1, 2013
179.023
+12.488
7.5%
jan 1, 2014
220.11
+41.088
22.95%
jan 1, 2015
223.744
+3.634
1.65%
Ranking of countries by current statistics by years


Comments: