29
/
en
AIzaSyAYiBZKx7MnpbEhh9jyipgxe19OcubqV5w
April 1, 2024
236812
Serbia
SRB
true
2
1
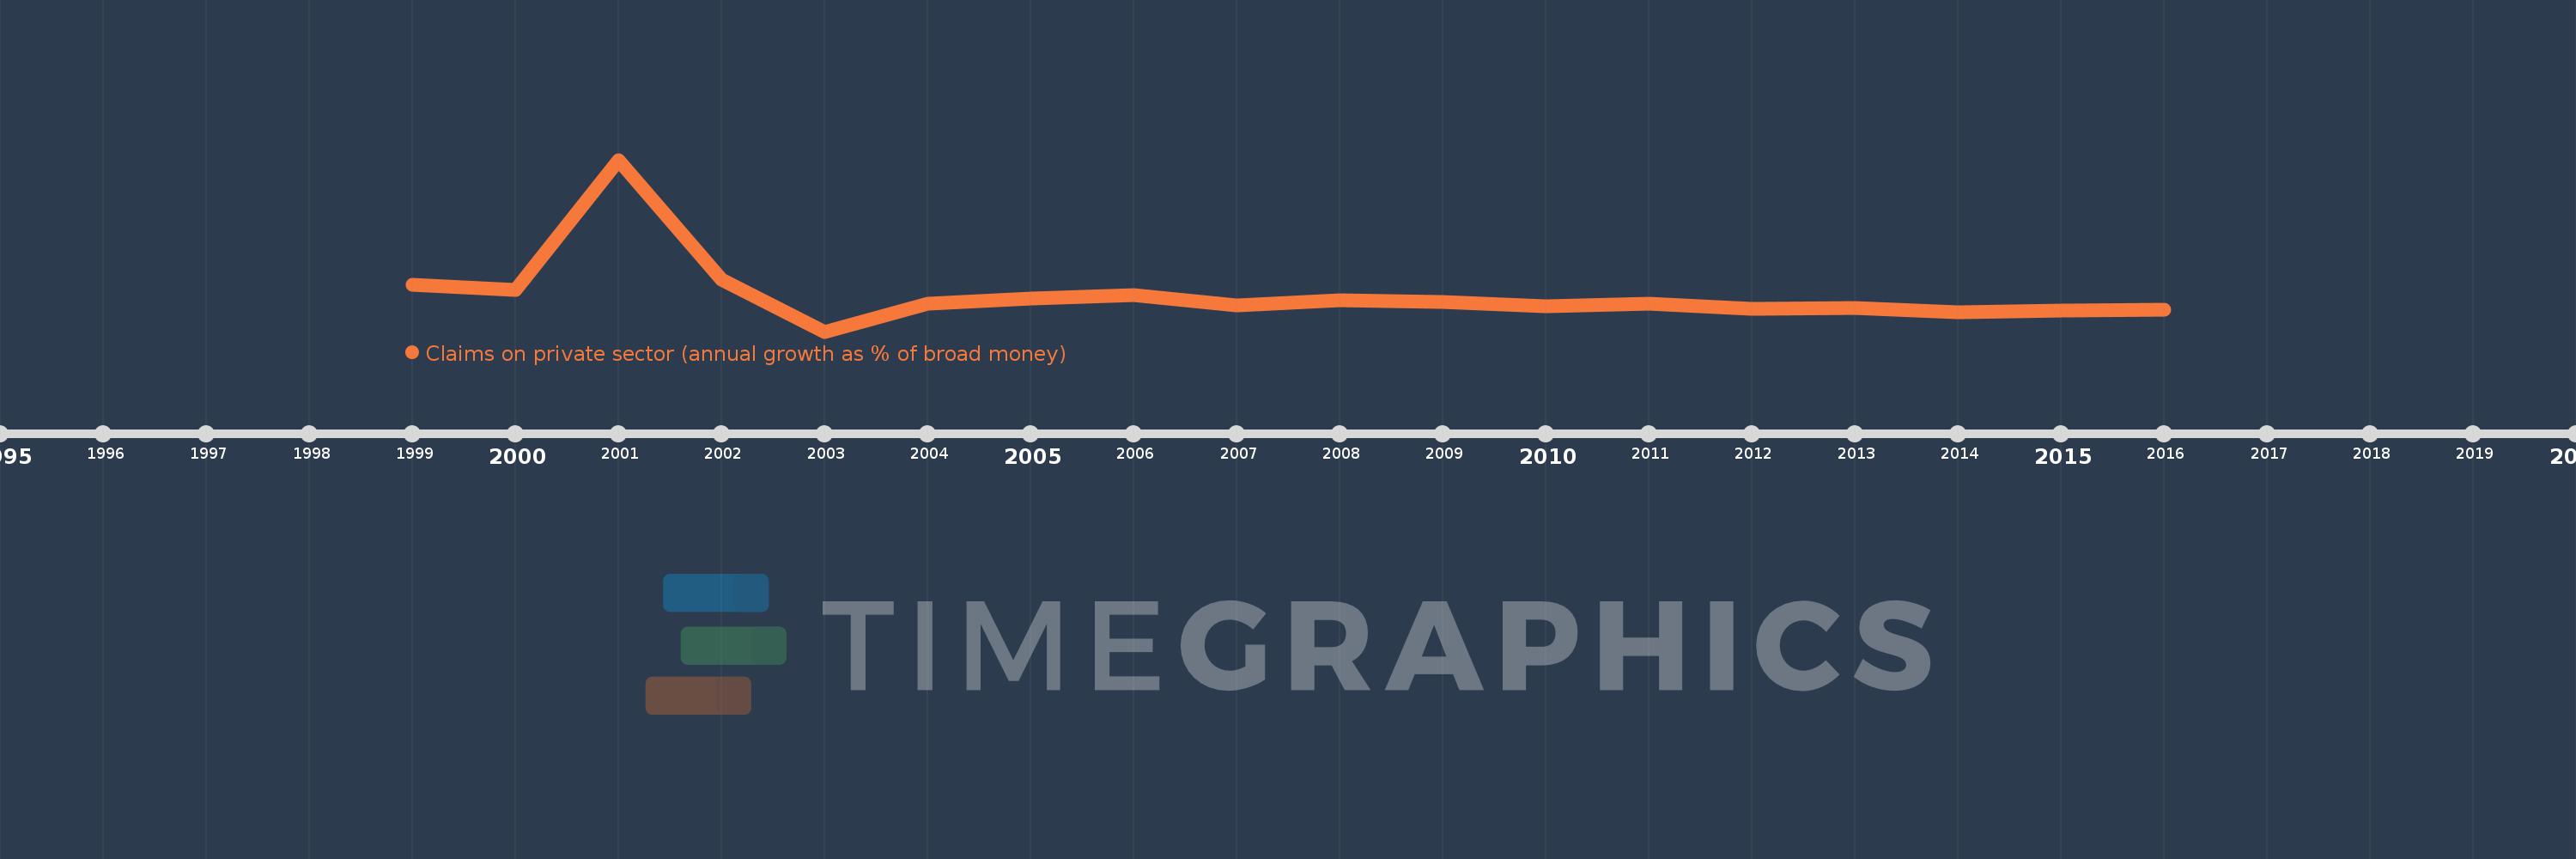
Claims on private sector (annual growth as % of broad money)
2016,2015,2014,2013,2012,2011,2010,2009,2008,2007,2006,2005,2004,2003,2002,2001,2000,1999
This statistics in other country:
AfghanistanAlbaniaAlgeriaAngolaAntigua and BarbudaArgentinaArmeniaArubaAustraliaAzerbaijanBahamas, TheBahrainBangladeshBarbadosBelarusBelizeBeninBhutanBoliviaBosnia and HerzegovinaBotswanaBrazilBrunei DarussalamBulgariaBurkina FasoBurundiCabo VerdeCambodiaCameroonCanadaCentral African RepublicChadChileChinaColombiaComorosCongo, Dem. Rep.Congo, Rep.Costa RicaCote d'IvoireCroatiaCzech RepublicDenmarkDjiboutiDominicaDominican RepublicEcuadorEgypt, Arab Rep.El SalvadorEquatorial GuineaEritreaEstoniaEthiopiaFijiGabonGambia, TheGeorgiaGhanaGrenadaGuatemalaGuineaGuinea-BissauGuyanaHaitiHondurasHong Kong SAR, ChinaHungaryIcelandIndiaIndonesiaIran, Islamic Rep.IraqIsraelJamaicaJapanJordanKazakhstanKenyaKorea, Rep.KuwaitKyrgyz RepublicLao PDRLatviaLebanonLesothoLiberiaLibyaLithuaniaMacao SAR, ChinaMacedonia, FYRMadagascarMalawiMalaysiaMaldivesMaliMauritaniaMauritiusMexicoMicronesia, Fed. Sts.MoldovaMongoliaMoroccoMozambiqueMyanmarNamibiaNepalNew ZealandNicaraguaNigerNigeriaNorwayOmanPakistanPanamaPapua New GuineaParaguayPeruPhilippinesPolandQatarRomaniaRussian FederationRwandaSamoaSao Tome and PrincipeSaudi ArabiaSenegalSerbiaSeychellesSierra LeoneSingaporeSlovak RepublicSolomon IslandsSouth AfricaSouth SudanSri LankaSt. Kitts and NevisSt. LuciaSt. Vincent and the GrenadinesSudanSurinameSwazilandSwedenSwitzerlandSyrian Arab RepublicTajikistanTanzaniaThailandTimor-LesteTogoTongaTrinidad and TobagoTunisiaTurkeyUgandaUkraineUnited Arab EmiratesUnited KingdomUnited StatesUruguayVanuatuVenezuela, RBVietnamWest Bank and GazaYemen, Rep.ZambiaZimbabwe Timeline:
This timeline shows a graph from 1999 to 2016 of Serbia. No data until 1998. Number of actual observations by date: 18.
Source name:
World Development Indicators
Source organization:
International Monetary Fund, International Financial Statistics and data files.
Categories, topics:
Financial Sector
Last updated:
apr 23, 2017
Indicators value changes by year
Minimum:
-71.613
jan 1, 2003
Maximum:
519.662
jan 1, 2001
At the date of observation
Value
Absolute change
Change from previous value
jan 1, 1999
88.527
+88.527
0.0%
jan 1, 2000
73.168
-15.359
-17.35%
jan 1, 2001
519.662
+446.494
610.23%
jan 1, 2002
105.839
-413.824
-79.63%
jan 1, 2003
-71.613
-177.452
-167.66%
jan 1, 2004
25.615
+97.228
-135.77%
jan 1, 2005
40.89
+15.275
59.63%
jan 1, 2006
52.915
+12.025
29.41%
jan 1, 2007
18.469
-34.445
-65.1%
jan 1, 2008
36.111
+17.642
95.52%
jan 1, 2009
29.653
-6.458
-17.88%
jan 1, 2010
15.588
-14.066
-47.43%
jan 1, 2011
25.581
+9.993
64.11%
jan 1, 2012
6.386
-19.195
-75.04%
jan 1, 2013
10.25
+3.864
60.51%
jan 1, 2014
-5.223
-15.473
-150.96%
jan 1, 2015
0.496
+5.719
-109.49%
jan 1, 2016
3.03
+2.535
511.33%
Ranking of countries by current statistics by years


Comments: