30
/
AIzaSyAYiBZKx7MnpbEhh9jyipgxe19OcubqV5w
April 1, 2024
233979
Sao Tome and Principe
STP
true
2
1
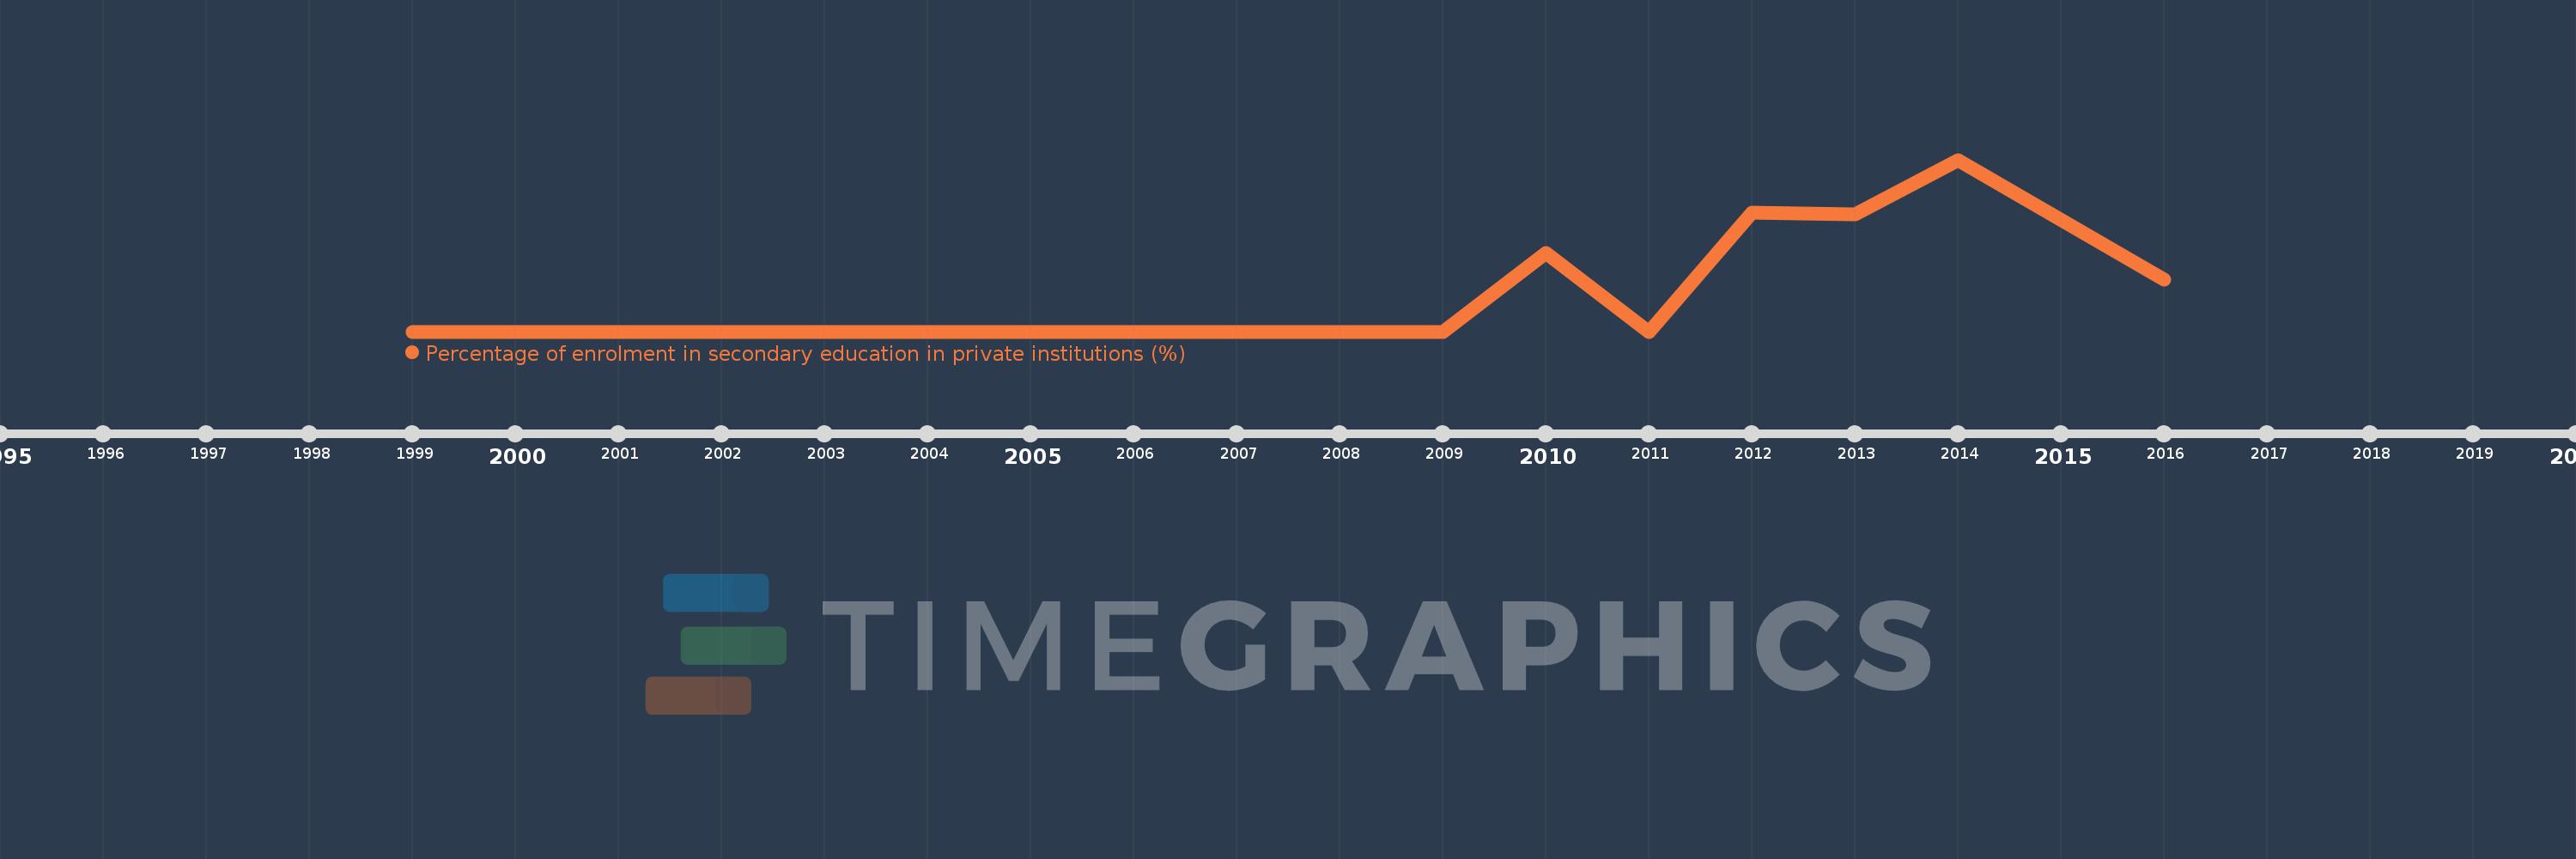
Percentage of enrolment in secondary education in private institutions (%)
2016,2014,2013,2012,2011,2010,2009,2008,2007,2006,2005,2004,2002,2001,1999
