29
/
en
AIzaSyAYiBZKx7MnpbEhh9jyipgxe19OcubqV5w
April 1, 2024
230303
Russian Federation
RUS
true
2
1
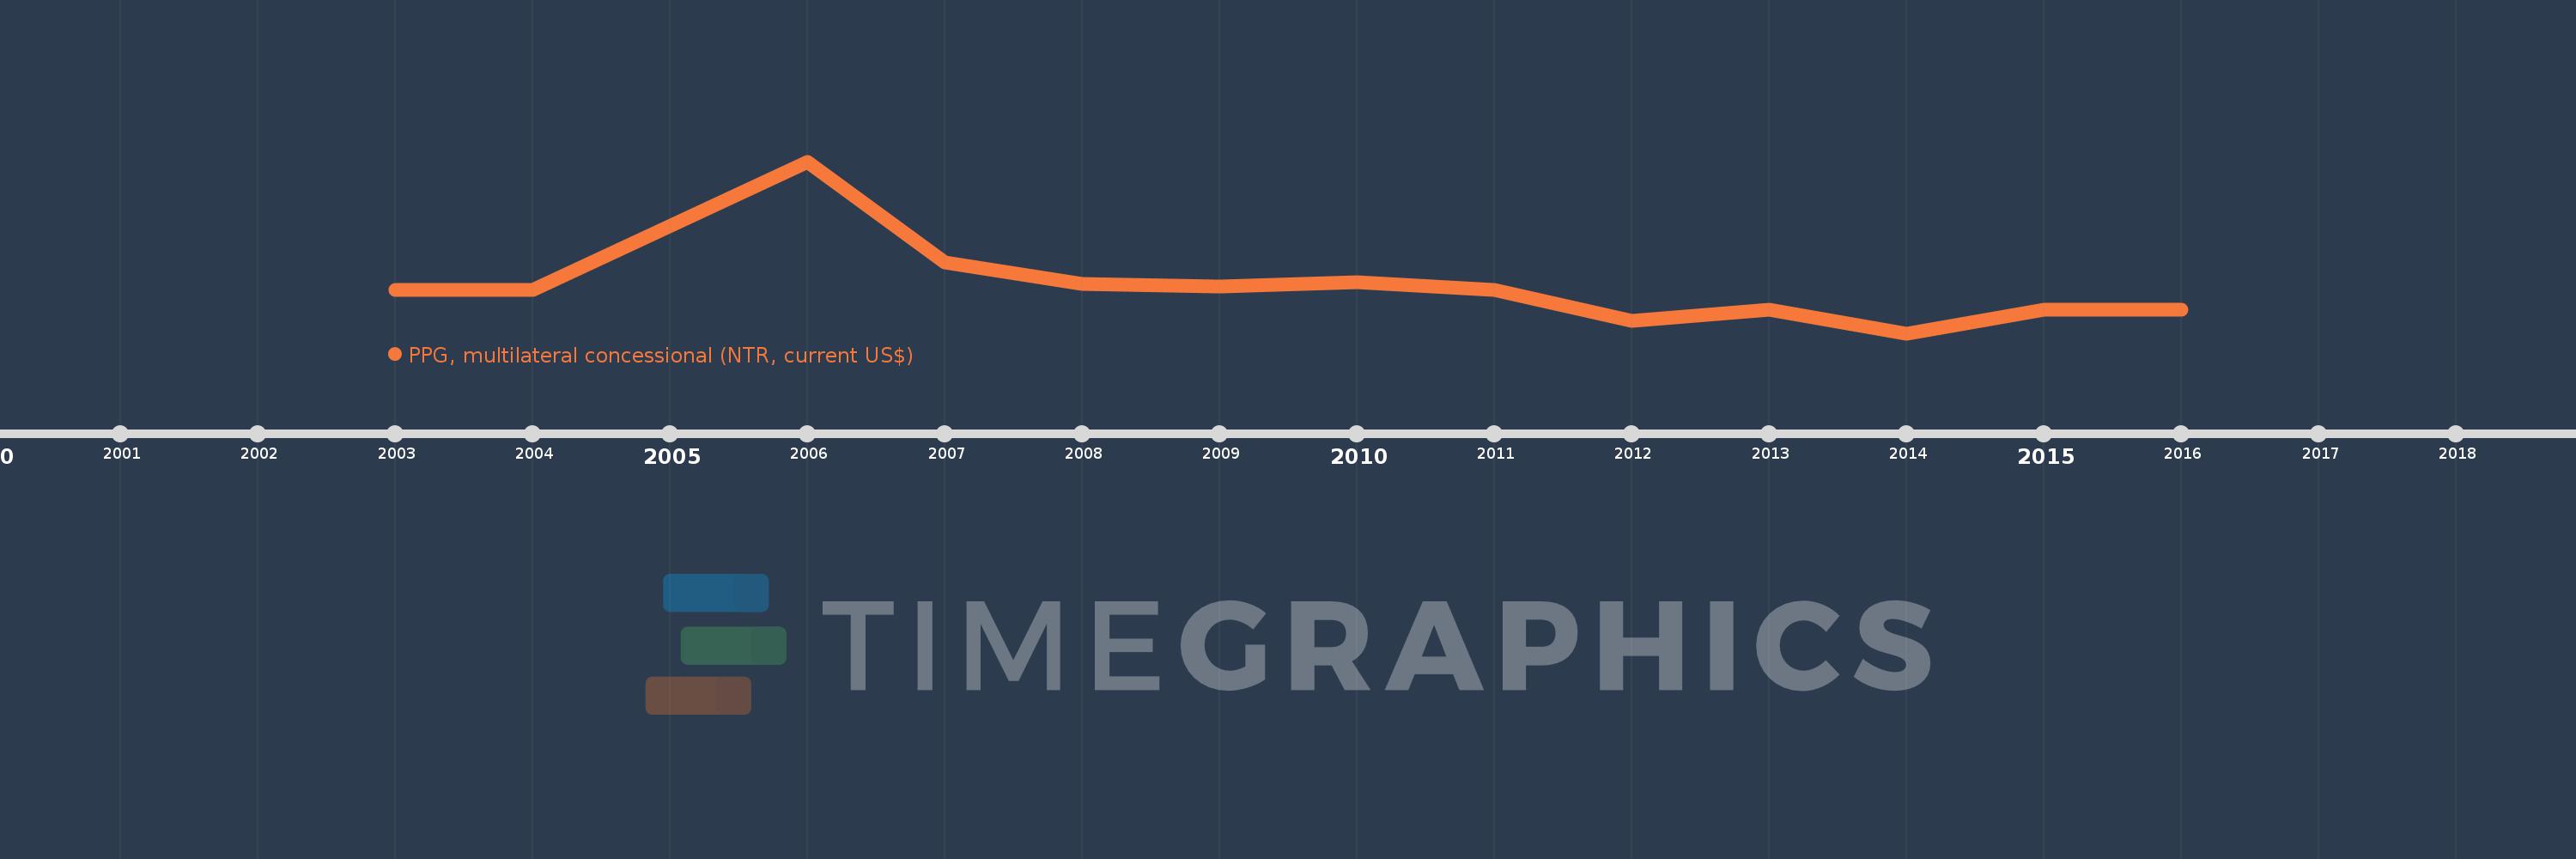
PPG, multilateral concessional (NTR, current US$)
2016,2015,2014,2013,2012,2011,2010,2009,2008,2007,2006,2004,2003
This statistics in other country:
Timeline:
This timeline shows a graph from 2003 to 2016 of Russian Federation. No data until 2002. Number of actual observations by date: 13.
Source name:
World Development Indicators
Source organization:
World Bank, International Debt Statistics.
Categories, topics:
External Debt
Last updated:
apr 23, 2017
Indicators value changes by year
Minimum:
-9.106 mln
jan 1, 2014
Maximum:
27.3 mln
jan 1, 2006
At the date of observation
Value
Absolute change
Change from previous value
jan 1, 2003
100.0K
+100.0K
0.0%
jan 1, 2004
-2.0K
-102.0K
-102.0%
jan 1, 2006
27.3 mln
+27.302 mln
-1.37 mln%
jan 1, 2007
5.927 mln
-21.373 mln
-78.29%
jan 1, 2008
1.28 mln
-4.647 mln
-78.4%
jan 1, 2009
827.0K
-453.0K
-35.39%
jan 1, 2010
1.646 mln
+819.0K
99.03%
jan 1, 2011
12.0K
-1.634 mln
-99.27%
jan 1, 2012
-6.538 mln
-6.55 mln
-54.58K%
jan 1, 2013
-4.128 mln
+2.41 mln
-36.86%
jan 1, 2014
-9.106 mln
-4.978 mln
120.59%
jan 1, 2015
-4.073 mln
+5.033 mln
-55.27%
jan 1, 2016
-4.049 mln
+24.0K
-0.59%
Ranking of countries by current statistics by years


Comments: