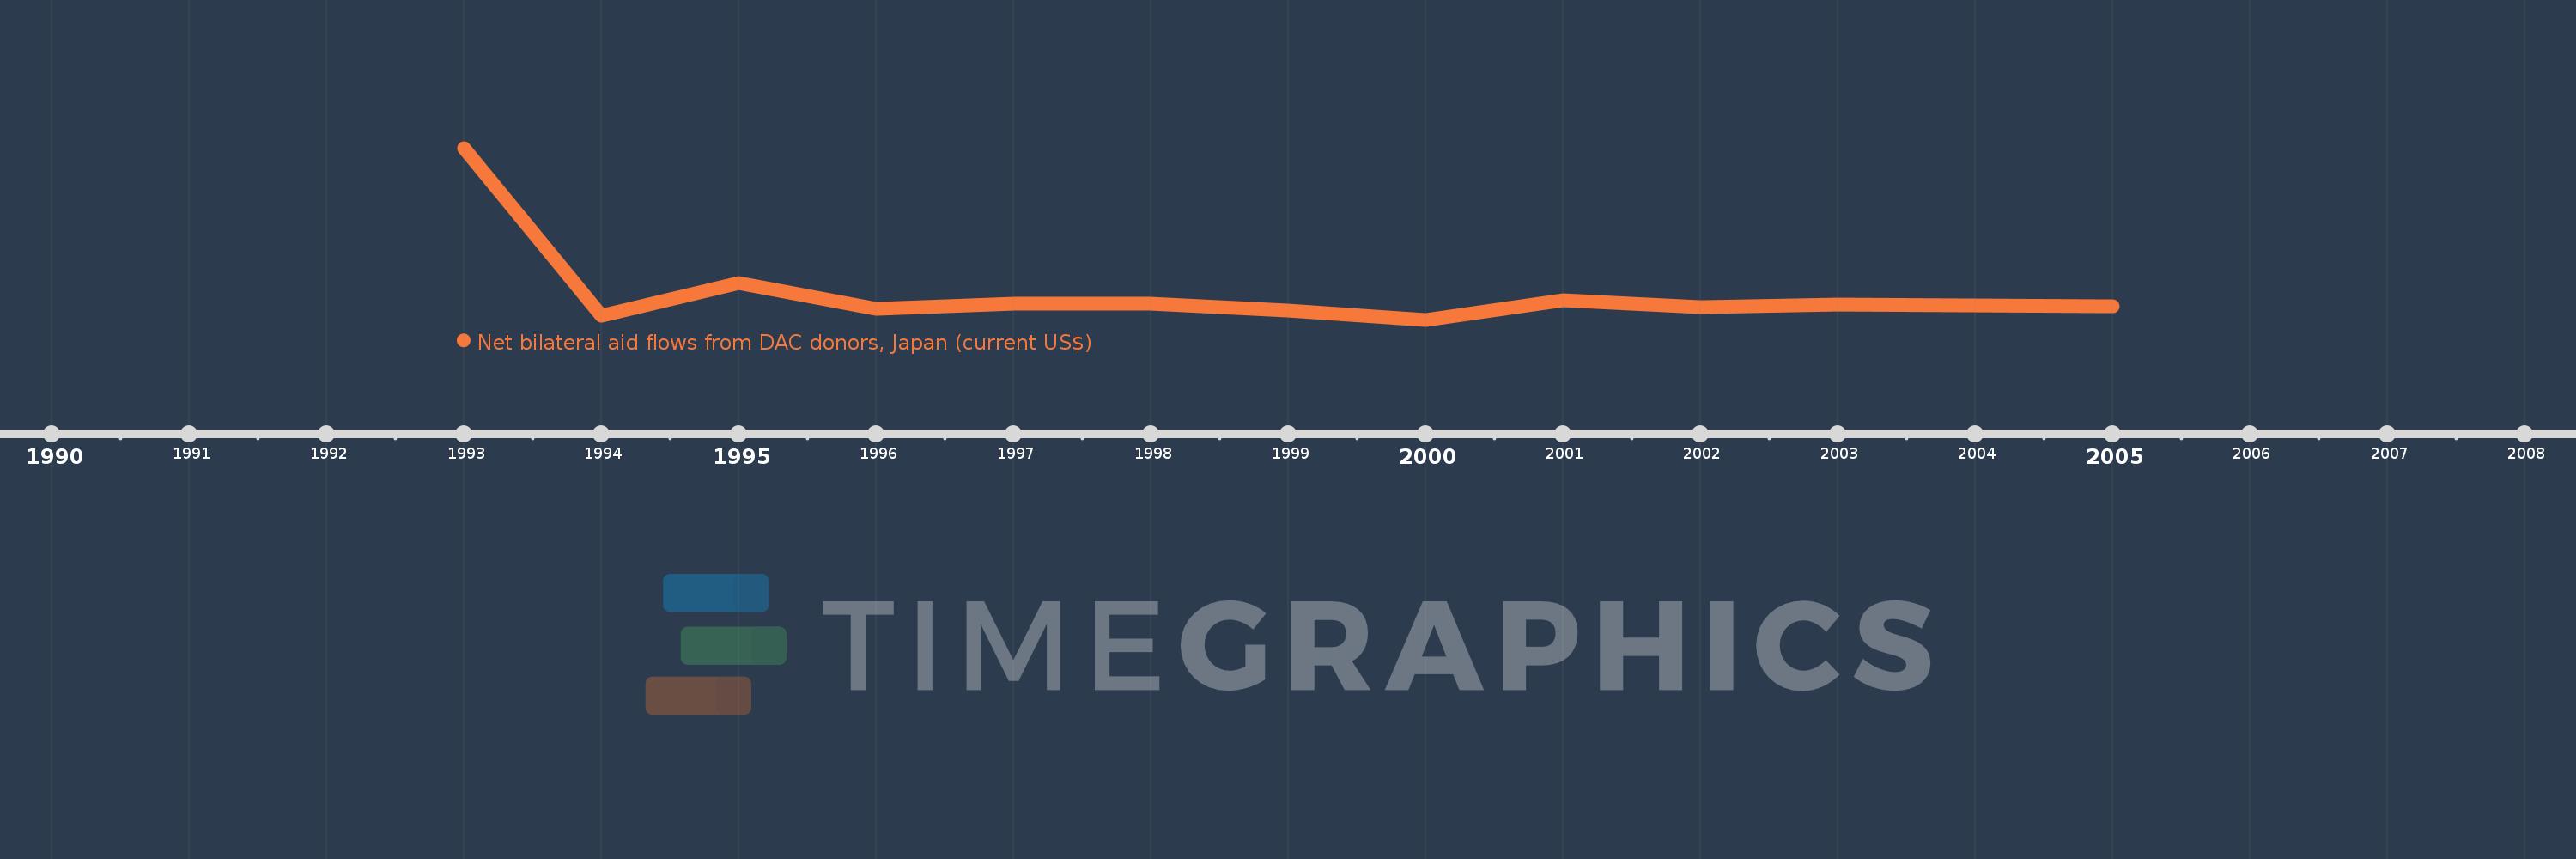
This timeline shows a graph from 1993 to 2005 of Russian Federation. No data until 1992. Number of actual observations by date: 13.
Source name:
World Development Indicators
Source organization:
Development Assistance Committee of the Organisation for Economic Co-operation and Development, Geographical Distribution of Financial Flows to Developing Countries, Development Co-operation Report, and International Development Statistics database. Data are available online at: www.oecd.org/dac/stats/idsonline.
Categories, topics:
Aid Effectiveness
Last updated:
apr 23, 2017
Indicators value changes by year
Meaning:
8.655 mln
Minimum:
500.0K
jan 1, 2000
Maximum:
54.22 mln
jan 1, 1993
At the date of observation
Value
Absolute change
Change from the previous value
jan 1, 1993
54.22 mln
+54.22 mln
0.0%
jan 1, 1994
1.74 mln
-52.48 mln
-96.79%
jan 1, 1995
12.02 mln
+10.28 mln
590.8%
jan 1, 1996
3.85 mln
-8.17 mln
-67.97%
jan 1, 1997
5.41 mln
+1.56 mln
40.52%
jan 1, 1998
5.56 mln
+150.0K
2.77%
jan 1, 1999
3.26 mln
-2.3 mln
-41.37%
jan 1, 2000
500.0K
-2.76 mln
-84.66%
jan 1, 2001
6.47 mln
+5.97 mln
1.19K%
jan 1, 2002
4.46 mln
-2.01 mln
-31.07%
jan 1, 2003
5.31 mln
+850.0K
19.06%
jan 1, 2004
4.89 mln
-420.0K
-7.91%
jan 1, 2005
4.82 mln
-70.0K
-1.43%
Ranking of countries by current statistics by years
