29
/
en
AIzaSyAYiBZKx7MnpbEhh9jyipgxe19OcubqV5w
April 1, 2024
229036
Romania
ROU
true
2
1
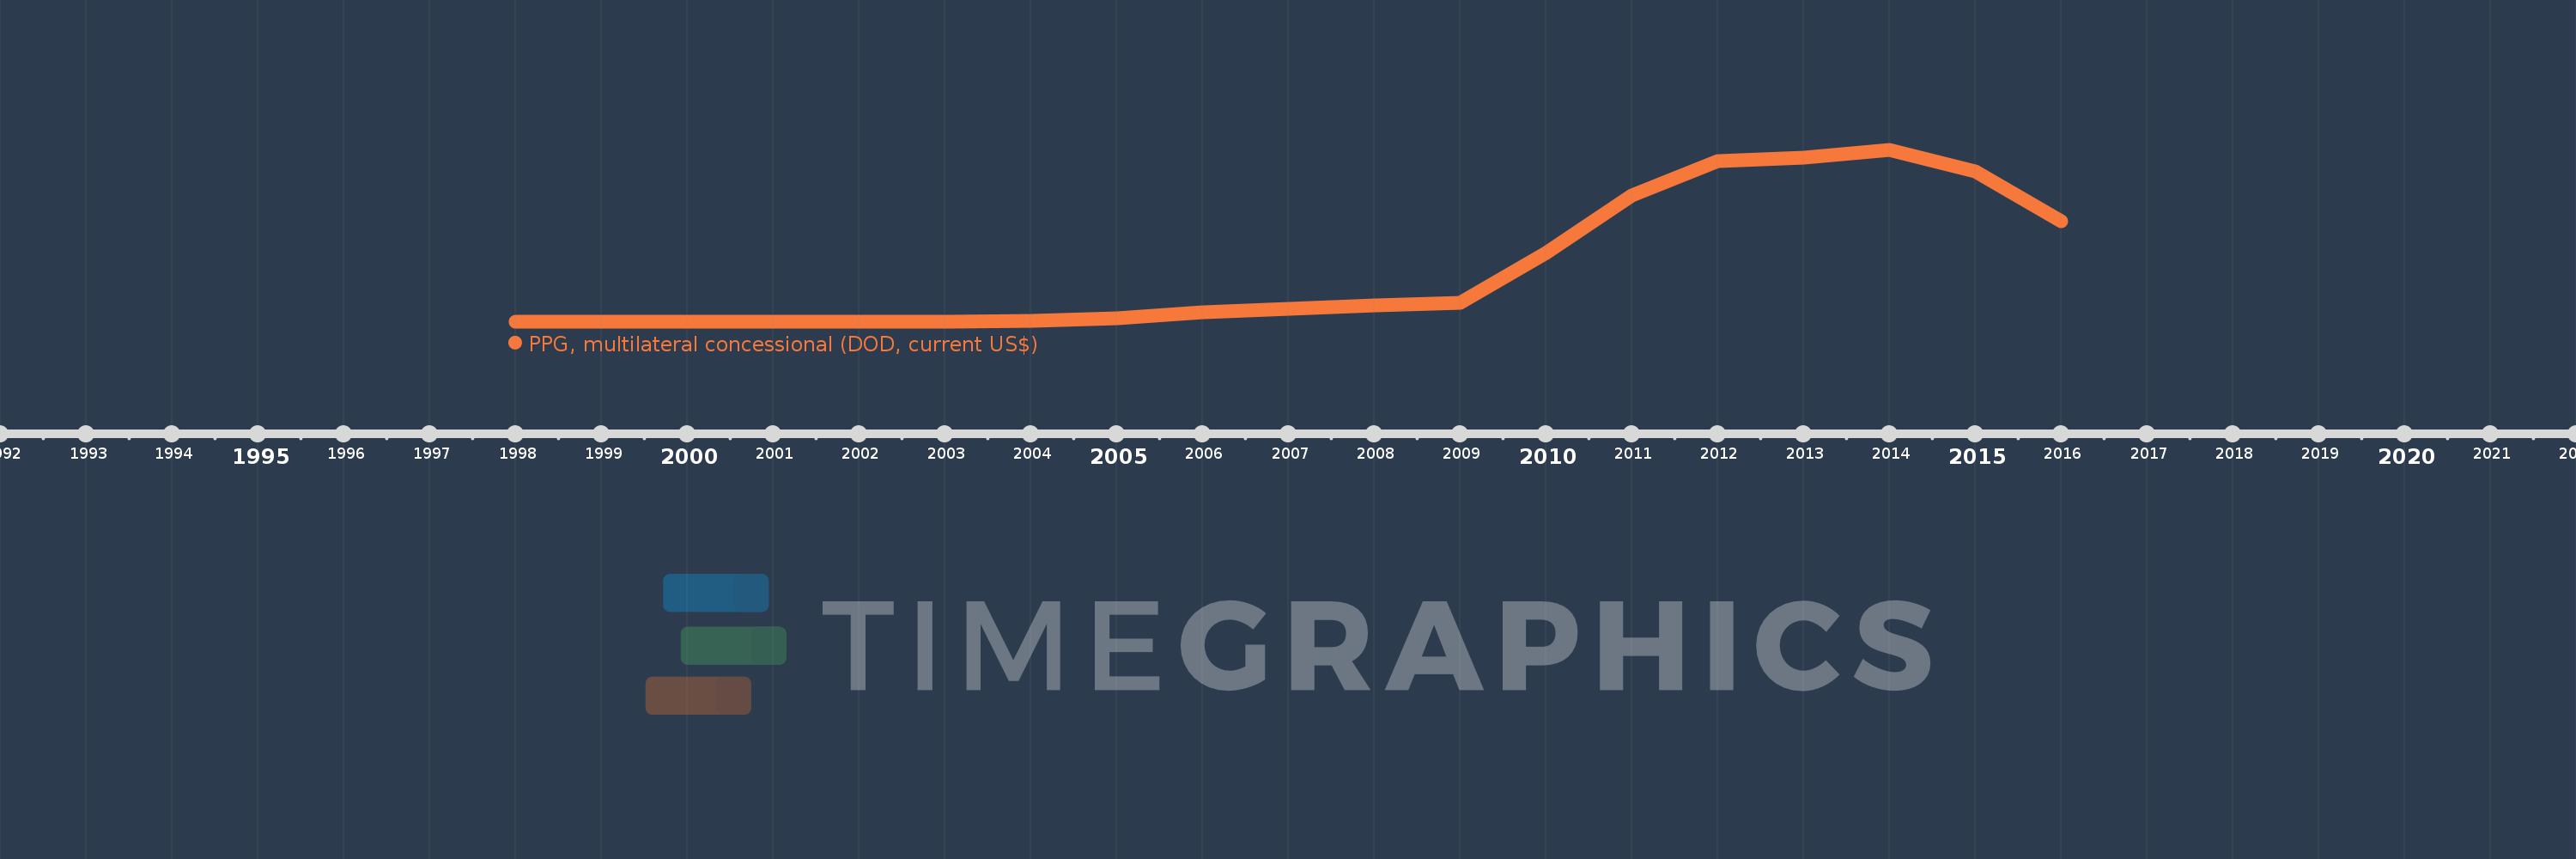
PPG, multilateral concessional (DOD, current US$)
2016,2015,2014,2013,2012,2011,2010,2009,2008,2007,2006,2005,2004,2003,2002,2001,2000,1999,1998
This statistics in other country:
Timeline:
This timeline shows a graph from 1998 to 2016 of Romania. No data until 1997. Number of actual observations by date: 19.
Source name:
World Development Indicators
Source organization:
World Bank, International Debt Statistics.
Categories, topics:
External Debt
Last updated:
apr 23, 2017
Indicators value changes by year
Maximum:
8.443 bln
jan 1, 2014
At the date of observation
Value
Absolute change
Change from previous value
jan 1, 1999
1.518 mln
+1.518 mln
%
jan 1, 2000
6.444 mln
+4.926 mln
324.51%
jan 1, 2001
14.782 mln
+8.338 mln
129.39%
jan 1, 2002
18.75 mln
+3.968 mln
26.84%
jan 1, 2003
21.79 mln
+3.04 mln
16.21%
jan 1, 2004
41.987 mln
+20.197 mln
92.69%
jan 1, 2005
182.81 mln
+140.823 mln
335.4%
jan 1, 2006
462.199 mln
+279.389 mln
152.83%
jan 1, 2007
629.085 mln
+166.886 mln
36.11%
jan 1, 2008
804.61 mln
+175.525 mln
27.9%
jan 1, 2009
929.959 mln
+125.349 mln
15.58%
jan 1, 2010
3.406 bln
+2.476 bln
266.23%
jan 1, 2011
6.209 bln
+2.804 bln
82.32%
jan 1, 2012
7.918 bln
+1.709 bln
27.52%
jan 1, 2013
8.066 bln
+147.857 mln
1.87%
jan 1, 2014
8.443 bln
+376.826 mln
4.67%
jan 1, 2015
7.402 bln
-1.041 bln
-12.33%
jan 1, 2016
4.942 bln
-2.46 bln
-33.24%
Ranking of countries by current statistics by years


Comments: