Download This statistics in other country:
Timeline:
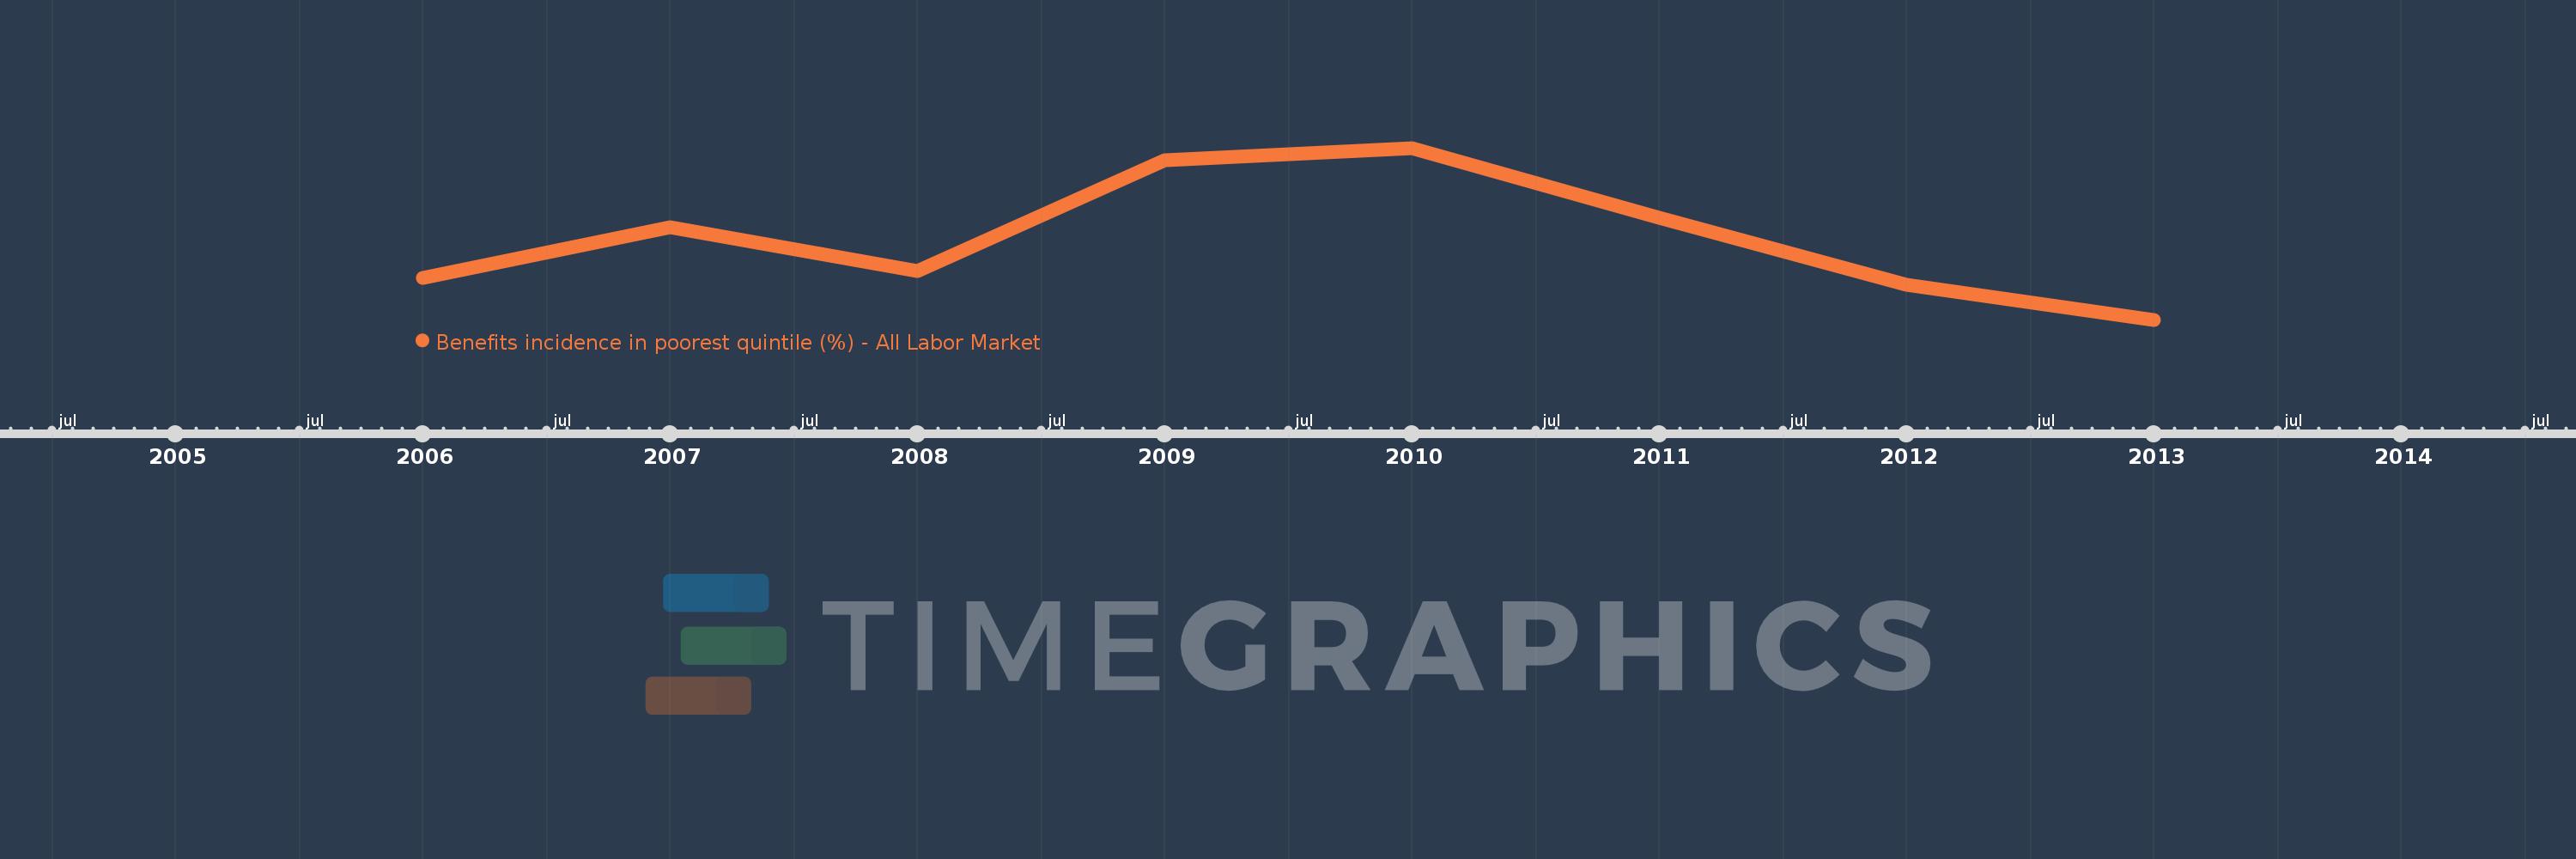
This timeline shows a graph from 2006 to 2013 of Poland. No data until 2005. Number of actual observations by date: 8.
Source name:
World Development Indicators
Source organization:
The Atlas of Social Protection: Indicators of Resilience and Equity (ASPIRE)
Categories, topics:
Social Protection & Labor
Last updated:
apr 23, 2017
Indicators value changes by year
Minimum:
24.764
jan 1, 2013
Maximum:
29.005
jan 1, 2010
At the date of observation
Value
Absolute change
Change from the previous value
jan 1, 2006
25.79
+25.79
0.0%
jan 1, 2007
27.043
+1.253
4.86%
jan 1, 2008
25.96
-1.083
-4.0%
jan 1, 2009
28.696
+2.736
10.54%
jan 1, 2010
29.005
+0.31
1.08%
jan 1, 2011
27.291
-1.714
-5.91%
jan 1, 2012
25.625
-1.666
-6.1%
jan 1, 2013
24.764
-0.861
-3.36%
Ranking of countries by current statistics by years
