29
/
en
AIzaSyAYiBZKx7MnpbEhh9jyipgxe19OcubqV5w
April 1, 2024
223071
Peru
PER
true
2
1
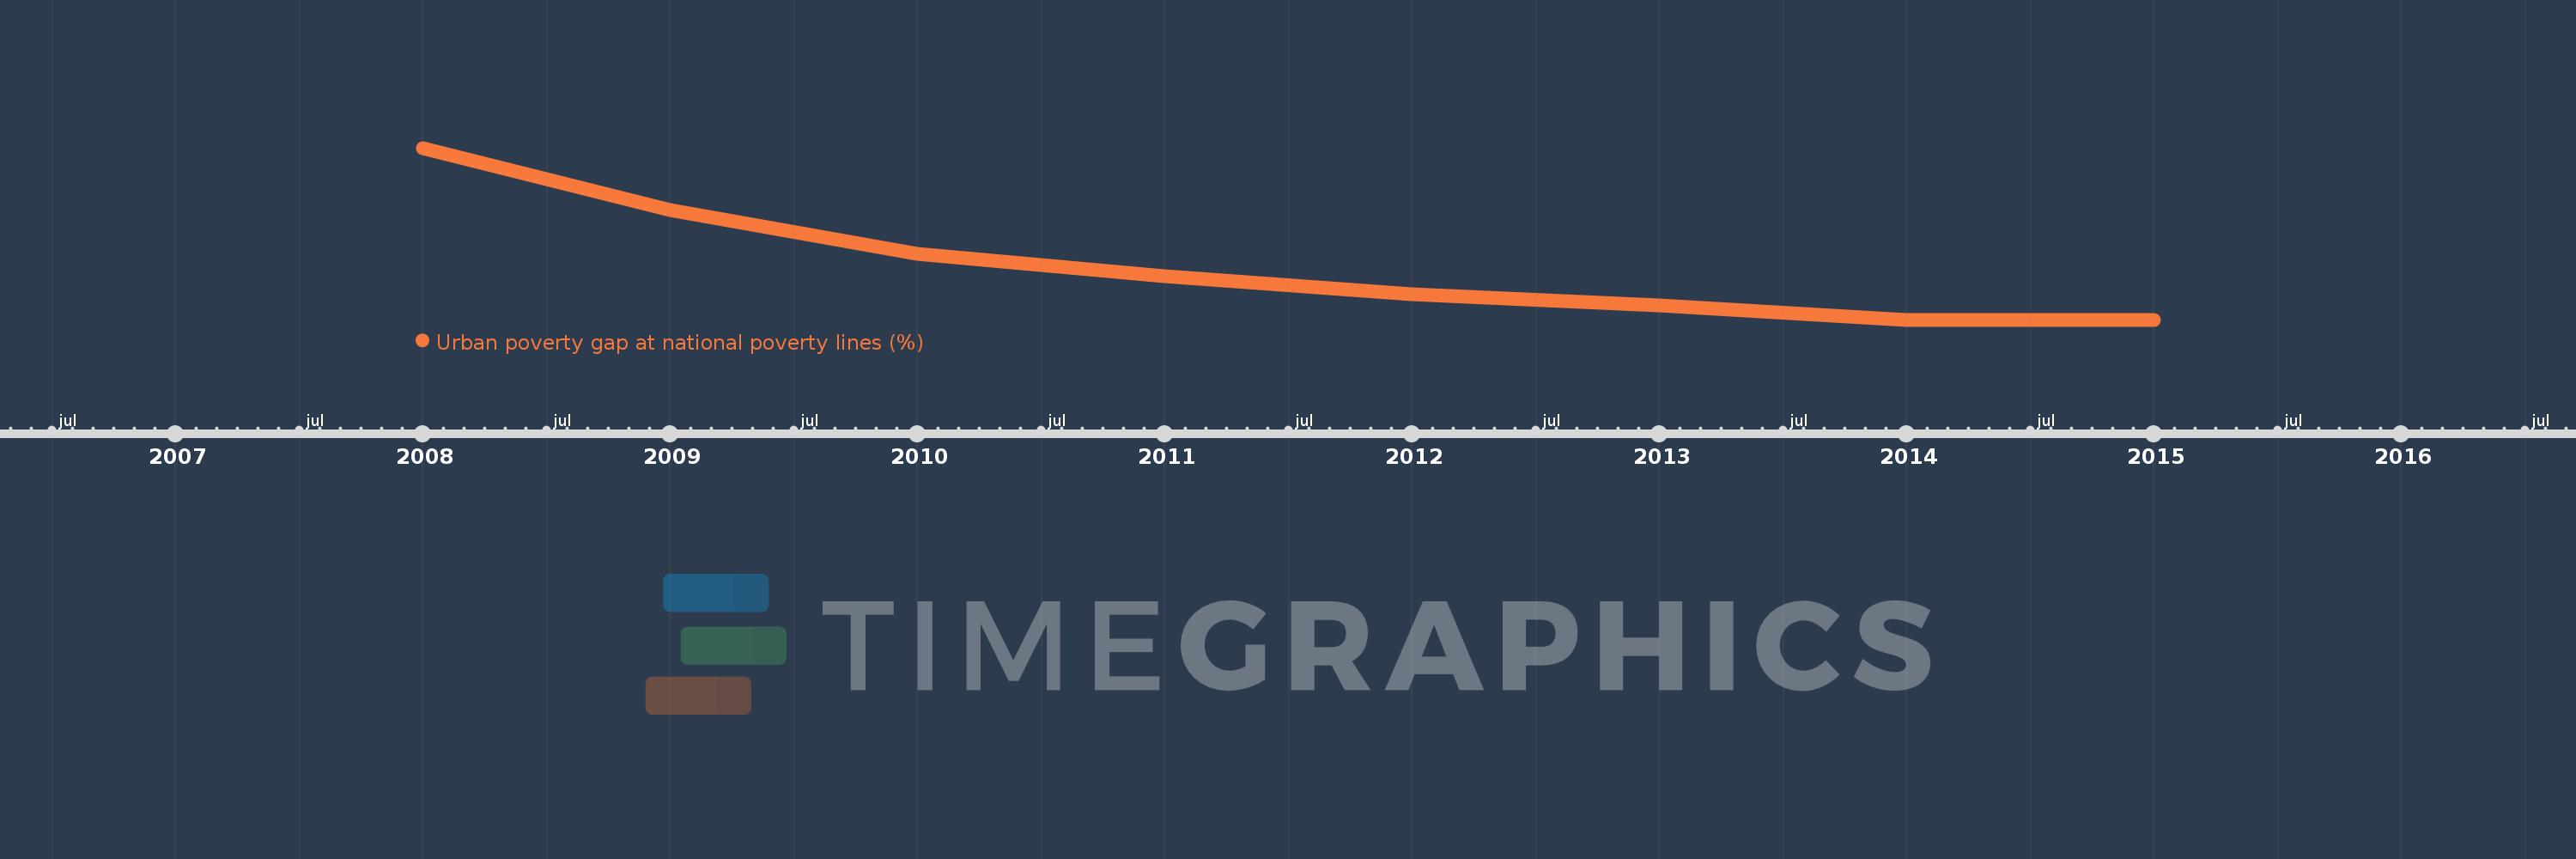
Urban poverty gap at national poverty lines (%)
2015,2014,2013,2012,2011,2010,2009,2008
This statistics in other country:
Timeline:
This timeline shows a graph from 2008 to 2015 of Peru. No data until 2007. Number of actual observations by date: 8.
Source name:
World Development Indicators
Source organization:
World Bank, Global Poverty Working Group. Data are compiled from official government sources or are computed by World Bank staff using national (i.e. country–specific) poverty lines.
Categories, topics:
Poverty, Urban Development
Last updated:
apr 23, 2017
Indicators value changes by year
At the date of observation
Value
Absolute change
Change from previous value
jan 1, 2009
6.3
-1.7
-21.25%
jan 1, 2010
5.1
-1.2
-19.05%
jan 1, 2011
4.5
-0.6
-11.76%
jan 1, 2012
4.0
-0.5
-11.11%
jan 1, 2013
3.7
-0.3
-7.5%
jan 1, 2014
3.3
-0.4
-10.81%
Ranking of countries by current statistics by years


Comments: