29
/
en
AIzaSyAYiBZKx7MnpbEhh9jyipgxe19OcubqV5w
April 1, 2024
214918
Norway
NOR
true
2
1
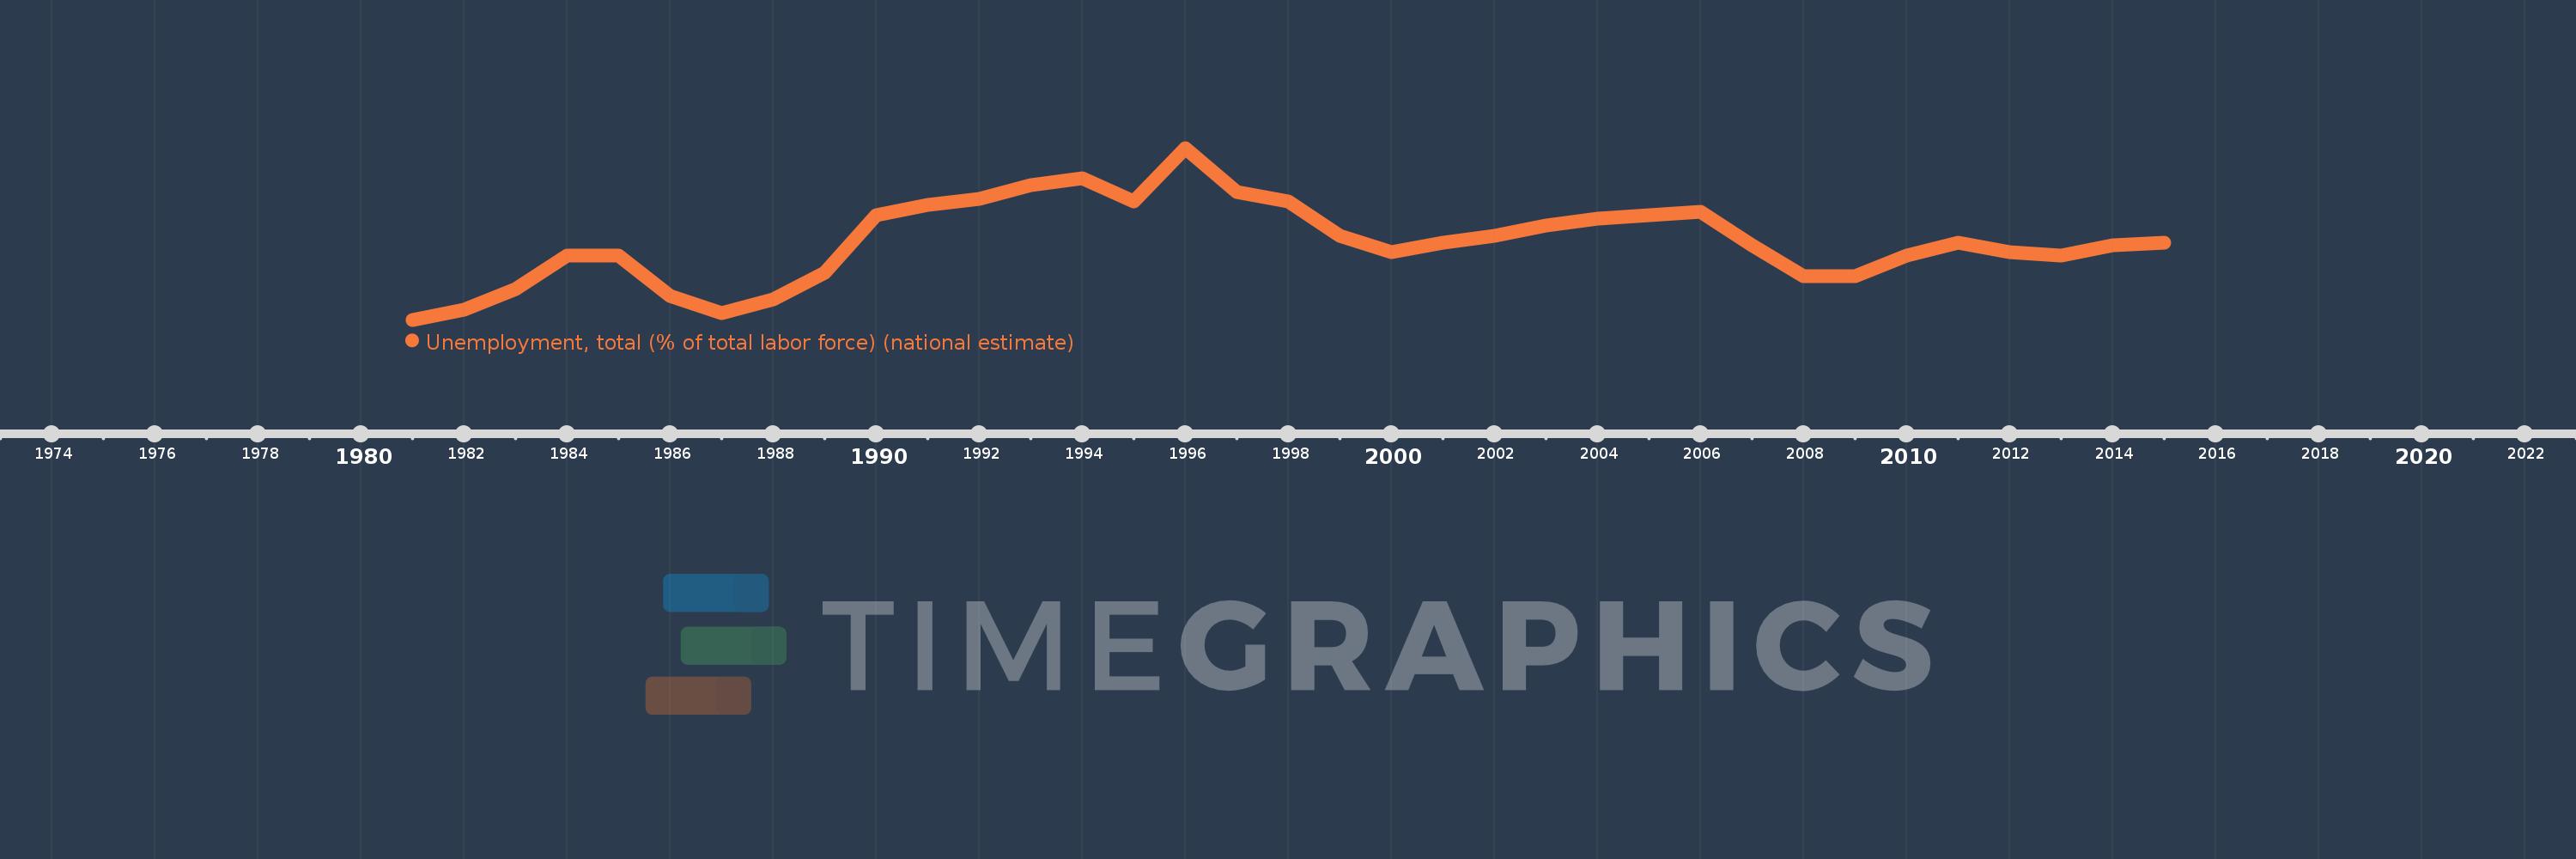
Unemployment, total (% of total labor force) (national estimate)
2015,2014,2013,2012,2011,2010,2009,2008,2007,2006,2005,2004,2003,2002,2001,2000,1999,1998,1997,1996,1995,1994,1993,1992,1991,1990,1989,1988,1987,1986,1985,1984,1983,1982,1981
This statistics in other country:
AfghanistanAlbaniaAlgeriaAmerican SamoaAntigua and BarbudaArab WorldArgentinaArmeniaArubaAustraliaAustriaAzerbaijanBahamas, TheBahrainBangladeshBarbadosBelarusBelgiumBelizeBeninBermudaBhutanBoliviaBosnia and HerzegovinaBotswanaBrazilBritish Virgin IslandsBrunei DarussalamBulgariaBurkina FasoBurundiCabo VerdeCambodiaCameroonCanadaCaribbean small statesCayman IslandsCentral Europe and the BalticsChadChileChinaColombiaComorosCongo, Dem. Rep.Costa RicaCote d'IvoireCroatiaCubaCyprusCzech RepublicDenmarkDjiboutiDominicaDominican RepublicEarly-demographic dividendEast Asia & PacificEast Asia & Pacific (excluding high income)East Asia & Pacific (IDA & IBRD countries)EcuadorEgypt, Arab Rep.El SalvadorEquatorial GuineaEstoniaEthiopiaEuro areaEurope & Central AsiaEurope & Central Asia (excluding high income)Europe & Central Asia (IDA & IBRD countries)European UnionFaroe IslandsFijiFinlandFranceFrench PolynesiaGabonGambia, TheGeorgiaGermanyGhanaGibraltarGreeceGreenlandGrenadaGuamGuatemalaGuineaGuyanaHaitiHigh incomeHondurasHong Kong SAR, ChinaHungaryIBRD onlyIcelandIDA & IBRD totalIDA blendIndiaIndonesiaIran, Islamic Rep.IraqIrelandIsle of ManIsraelItalyJamaicaJapanJordanKazakhstanKenyaKiribatiKorea, Rep.KosovoKuwaitKyrgyz RepublicLao PDRLate-demographic dividendLatin America & Caribbean Latin America & Caribbean (excluding high income)Latin America & the Caribbean (IDA & IBRD countries)LatviaLebanonLesothoLiberiaLibyaLiechtensteinLithuaniaLow & middle incomeLower middle incomeLuxembourgMacao SAR, ChinaMacedonia, FYRMadagascarMalawiMalaysiaMaldivesMaliMaltaMarshall IslandsMauritaniaMauritiusMexicoMiddle East & North AfricaMiddle East & North Africa (excluding high income)Middle East & North Africa (IDA & IBRD countries)Middle incomeMoldovaMonacoMongoliaMontenegroMoroccoMozambiqueMyanmarNamibiaNauruNepalNetherlandsNew CaledoniaNew ZealandNicaraguaNigerNigeriaNorth AmericaNorthern Mariana IslandsNorwayOECD membersPakistanPalauPanamaPapua New GuineaParaguayPeruPhilippinesPolandPortugalPost-demographic dividendPuerto RicoQatarRomaniaRussian FederationRwandaSamoaSan MarinoSao Tome and PrincipeSaudi ArabiaSenegalSerbiaSeychellesSierra LeoneSingaporeSlovak RepublicSloveniaSolomon IslandsSouth AfricaSouth AsiaSouth Asia (IDA & IBRD)South SudanSpainSri LankaSt. Kitts and NevisSt. LuciaSt. Vincent and the GrenadinesSudanSurinameSwazilandSwedenSwitzerlandSyrian Arab RepublicTajikistanTanzaniaThailandTimor-LesteTongaTrinidad and TobagoTunisiaTurkeyTurks and Caicos IslandsTuvaluUgandaUkraineUnited Arab EmiratesUnited KingdomUnited StatesUpper middle incomeUruguayVanuatuVenezuela, RBVietnamWest Bank and GazaWorldYemen, Rep.ZambiaZimbabwe Timeline:
This timeline shows a graph from 1981 to 2015 of Norway. No data until 1980. Number of actual observations by date: 35.
Source name:
World Development Indicators
Source organization:
International Labour Organization, Key Indicators of the Labour Market database.
Categories, topics:
Social Protection & Labor
Last updated:
apr 23, 2017
Indicators value changes by year
At the date of observation
Value
Absolute change
Change from previous value
jan 1, 1982
1.5
+0.3
25.0%
jan 1, 1983
2.1
+0.6
40.0%
jan 1, 1984
3.1
+1.0
47.62%
jan 1, 1986
1.9
-1.2
-38.71%
jan 1, 1987
1.4
-0.5
-26.32%
jan 1, 1988
1.8
+0.4
28.57%
jan 1, 1989
2.6
+0.8
44.44%
jan 1, 1990
4.3
+1.7
65.38%
jan 1, 1991
4.6
+0.3
6.98%
jan 1, 1992
4.8
+0.2
4.35%
jan 1, 1993
5.2
+0.4
8.33%
jan 1, 1994
5.4
+0.2
3.85%
jan 1, 1995
4.7
-0.7
-12.96%
jan 1, 1996
6.3
+1.6
34.04%
jan 1, 1997
5.0
-1.3
-20.63%
jan 1, 1998
4.7
-0.3
-6.0%
jan 1, 1999
3.7
-1.0
-21.28%
jan 1, 2000
3.2
-0.5
-13.51%
jan 1, 2001
3.5
+0.3
9.37%
jan 1, 2002
3.7
+0.2
5.71%
jan 1, 2003
4.0
+0.3
8.11%
jan 1, 2005
4.3
+0.1
2.38%
jan 1, 2006
4.4
+0.1
2.33%
jan 1, 2007
3.4
-1.0
-22.73%
jan 1, 2008
2.5
-0.9
-26.47%
jan 1, 2010
3.1
+0.6
24.0%
jan 1, 2011
3.5
+0.4
12.9%
jan 1, 2012
3.2
-0.3
-8.57%
jan 1, 2013
3.1
-0.1
-3.13%
jan 1, 2014
3.4
+0.3
9.68%
jan 1, 2015
3.5
+0.1
2.94%
Ranking of countries by current statistics by years


Comments: