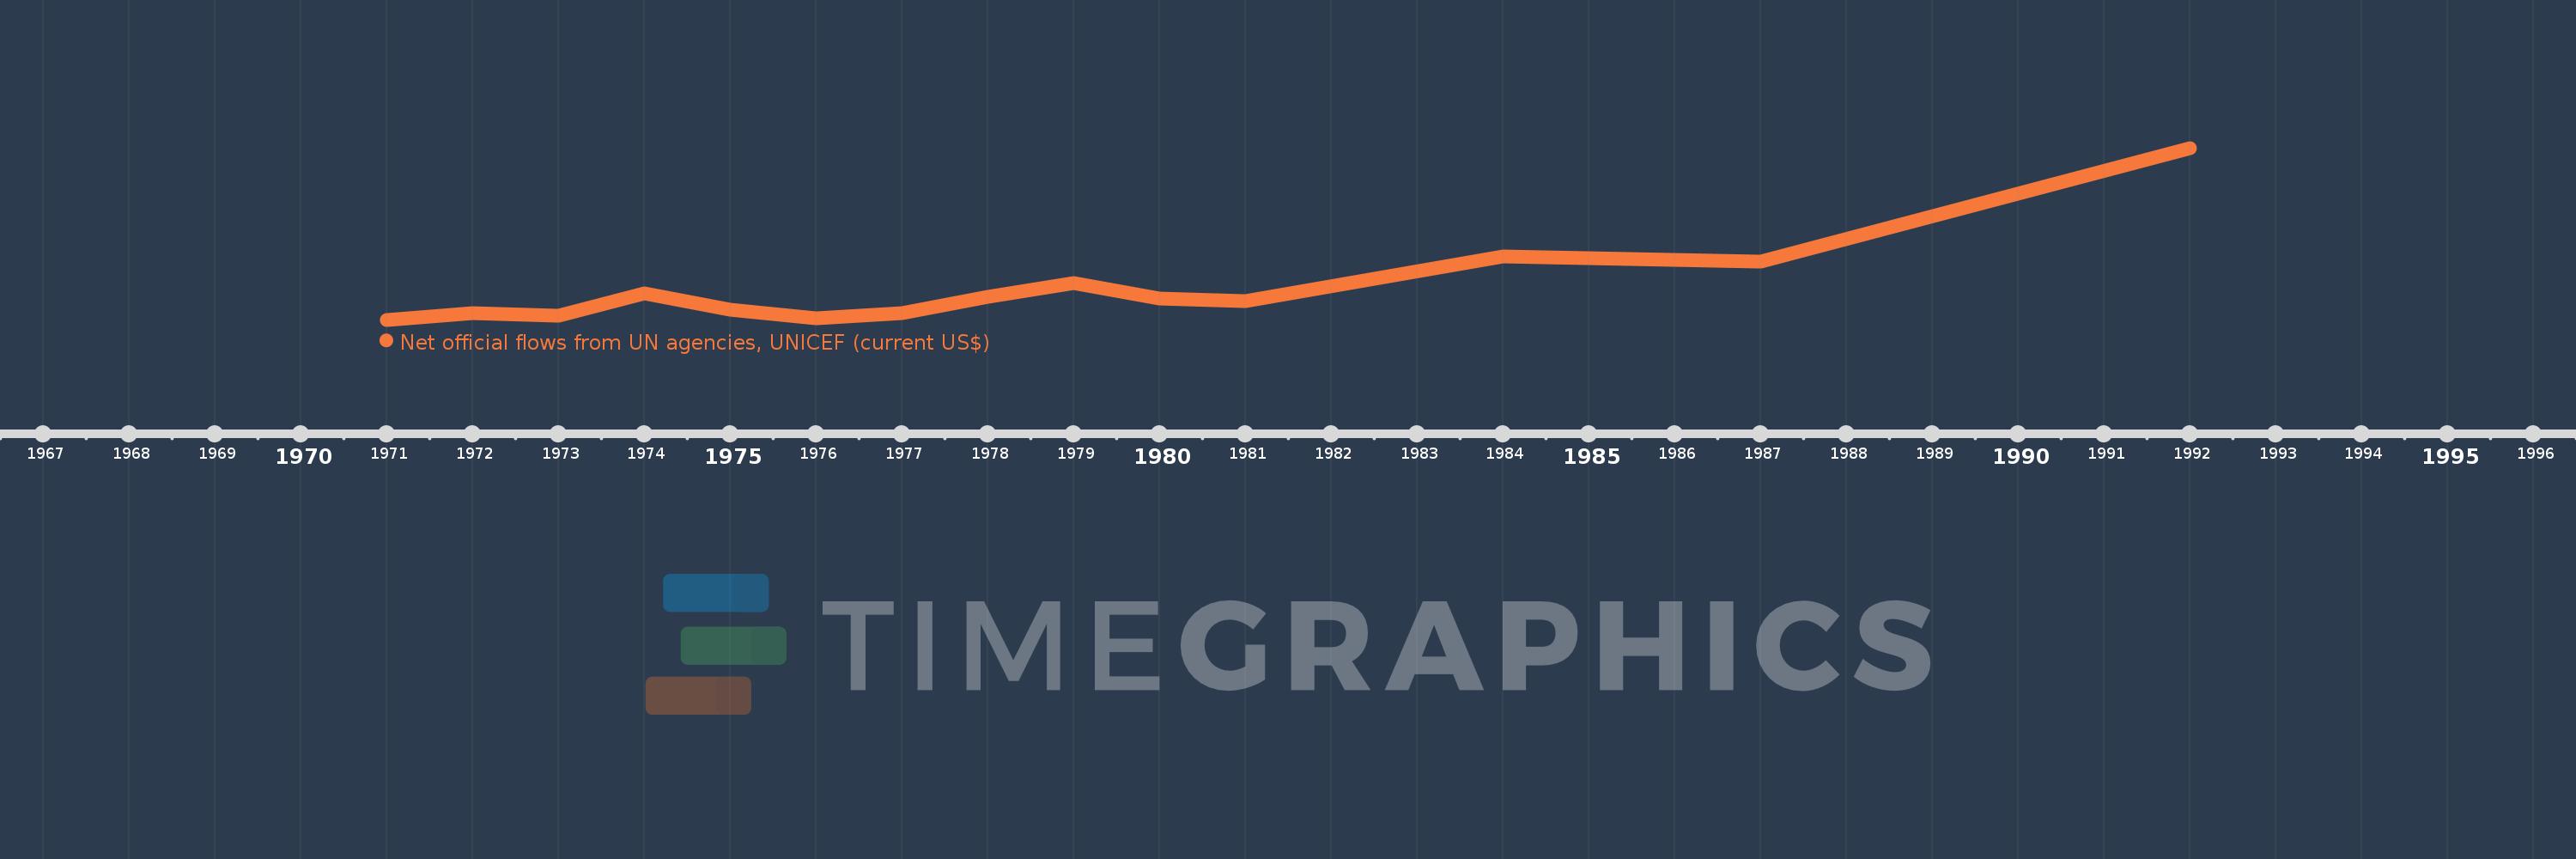
This timeline shows a graph from 1971 to 1992 of Northern Mariana Islands. No data until 1970. Number of actual observations by date: 14.
Source name:
World Development Indicators
Source organization:
Development Assistance Committee of the Organisation for Economic Co-operation and Development, Geographical Distribution of Financial Flows to Developing Countries, Development Co-operation Report, and International Development Statistics database. Data are available online at: www.oecd.org/dac/stats/idsonline.
Categories, topics:
Aid Effectiveness
Last updated:
apr 23, 2017
Indicators value changes by year
Meaning:
357.143K
Minimum:
130.0K
jan 1, 1971
Maximum:
1.35 mln
jan 1, 1992
At the date of observation
Value
Absolute change
Change from the previous value
jan 1, 1971
130.0K
+130.0K
0.0%
jan 1, 1972
180.0K
+50.0K
38.46%
jan 1, 1973
160.0K
-20.0K
-11.11%
jan 1, 1974
320.0K
+160.0K
100.0%
jan 1, 1975
200.0K
-120.0K
-37.5%
jan 1, 1976
140.0K
-60.0K
-30.0%
jan 1, 1977
180.0K
+40.0K
28.57%
jan 1, 1978
290.0K
+110.0K
61.11%
jan 1, 1979
390.0K
+100.0K
34.48%
jan 1, 1980
280.0K
-110.0K
-28.21%
jan 1, 1981
260.0K
-20.0K
-7.14%
jan 1, 1984
580.0K
+320.0K
123.08%
jan 1, 1987
540.0K
-40.0K
-6.9%
jan 1, 1992
1.35 mln
+810.0K
150.0%
Ranking of countries by current statistics by years
