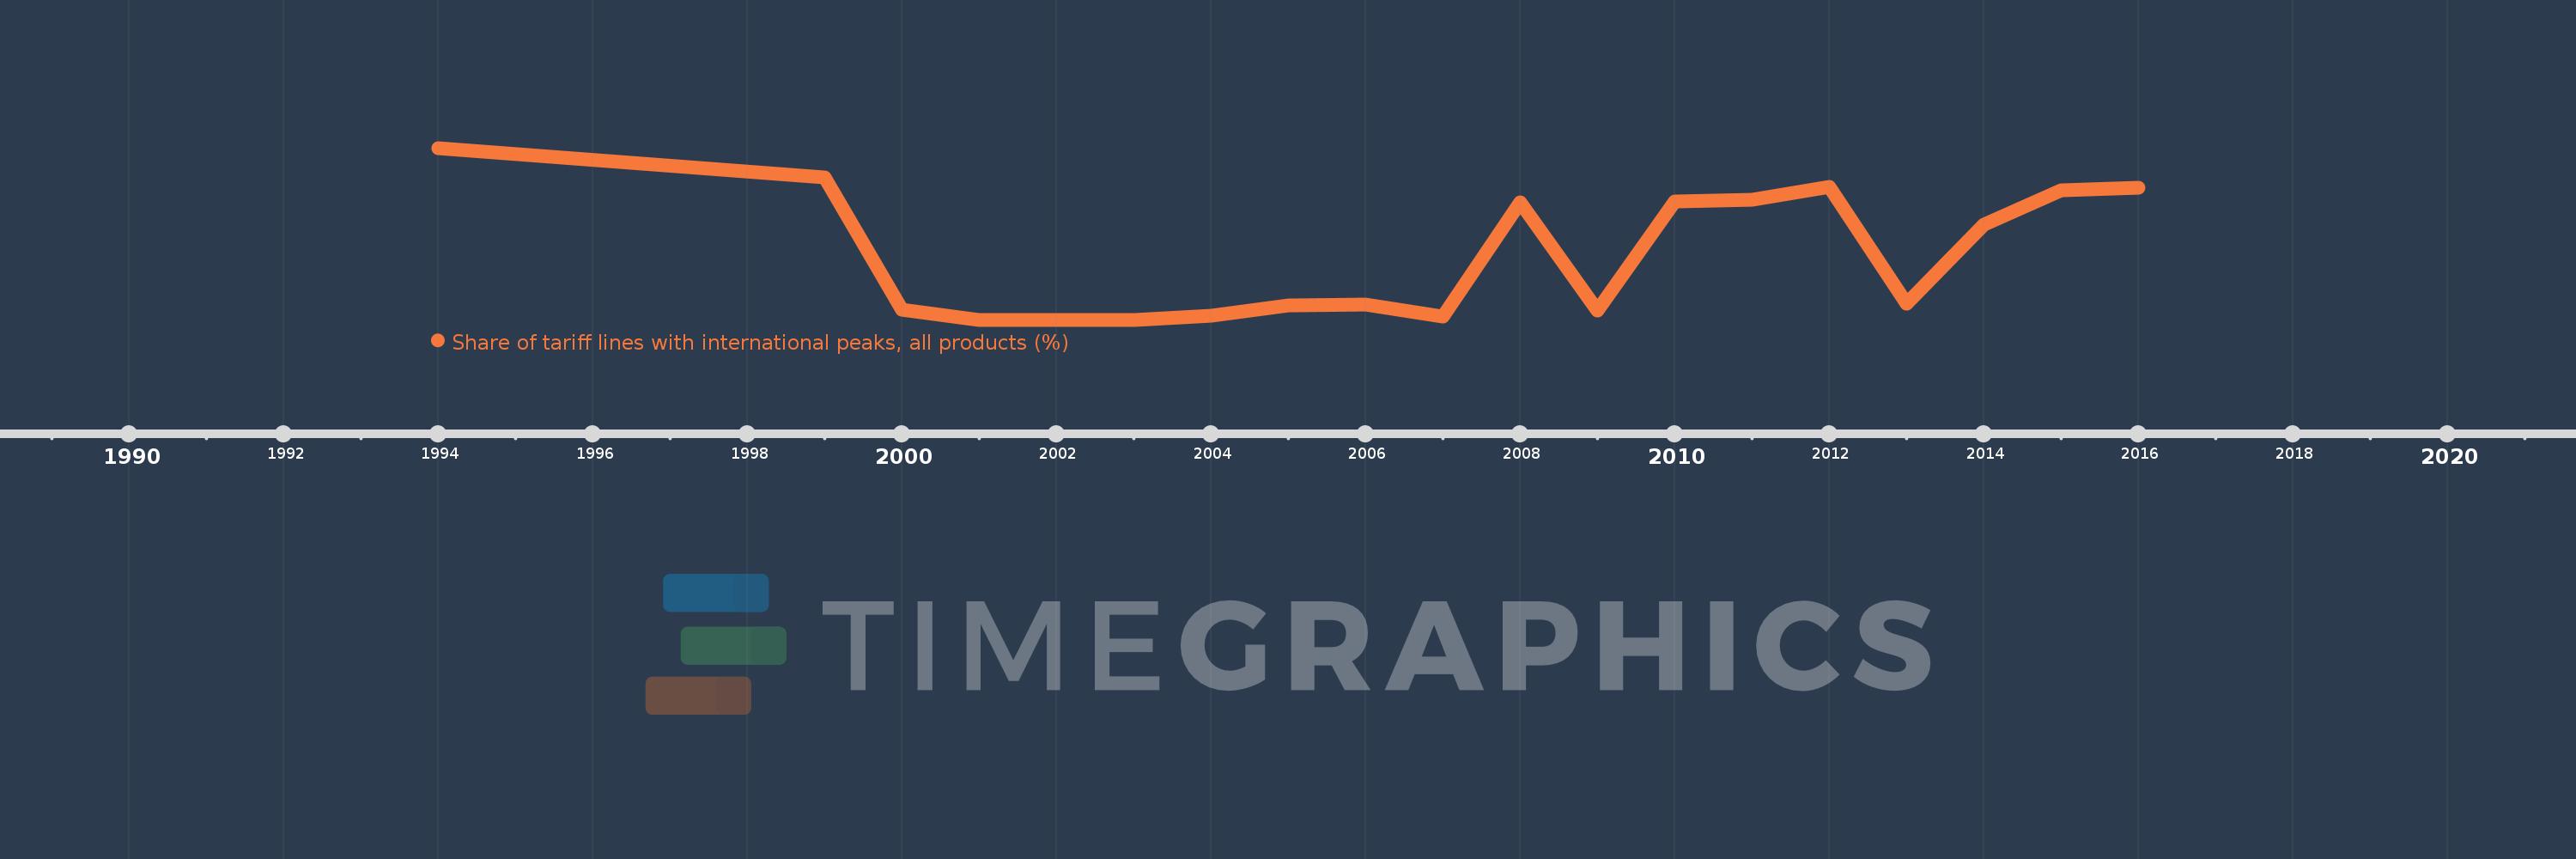
This timeline shows a graph from 1994 to 2016 of Nepal. No data until 1993. Number of actual observations by date: 18.
Source name:
World Development Indicators
Source organization:
World Bank staff estimates using the World Integrated Trade Solution system, based on data from United Nations Conference on Trade and Development's Trade Analysis and Information System (TRAINS) database.
Categories, topics:
Private Sector, Trade
Last updated:
apr 23, 2017
Indicators value changes by year
Meaning:
33.493
Minimum:
18.142
jan 1, 2001
Maximum:
56.727
jan 1, 1994
At the date of observation
Value
Absolute change
Change from the previous value
jan 1, 1994
56.727
+56.727
0.0%
jan 1, 1999
50.156
-6.57
-11.58%
jan 1, 2000
20.341
-29.815
-59.44%
jan 1, 2001
18.142
-2.199
-10.81%
jan 1, 2003
18.172
+0.03
0.17%
jan 1, 2004
19.067
+0.895
4.92%
jan 1, 2005
21.301
+2.234
11.72%
jan 1, 2006
21.594
+0.293
1.38%
jan 1, 2007
18.87
-2.724
-12.61%
jan 1, 2008
44.443
+25.573
135.52%
jan 1, 2009
20.194
-24.249
-54.56%
jan 1, 2010
44.615
+24.421
120.93%
jan 1, 2011
45.025
+0.41
0.92%
jan 1, 2012
48.035
+3.01
6.69%
jan 1, 2013
21.775
-26.259
-54.67%
jan 1, 2014
39.441
+17.666
81.13%
jan 1, 2015
47.278
+7.837
19.87%
jan 1, 2016
47.702
+0.424
0.9%
Ranking of countries by current statistics by years
