29
/
en
AIzaSyAYiBZKx7MnpbEhh9jyipgxe19OcubqV5w
April 1, 2024
206536
Nepal
NPL
true
2
1
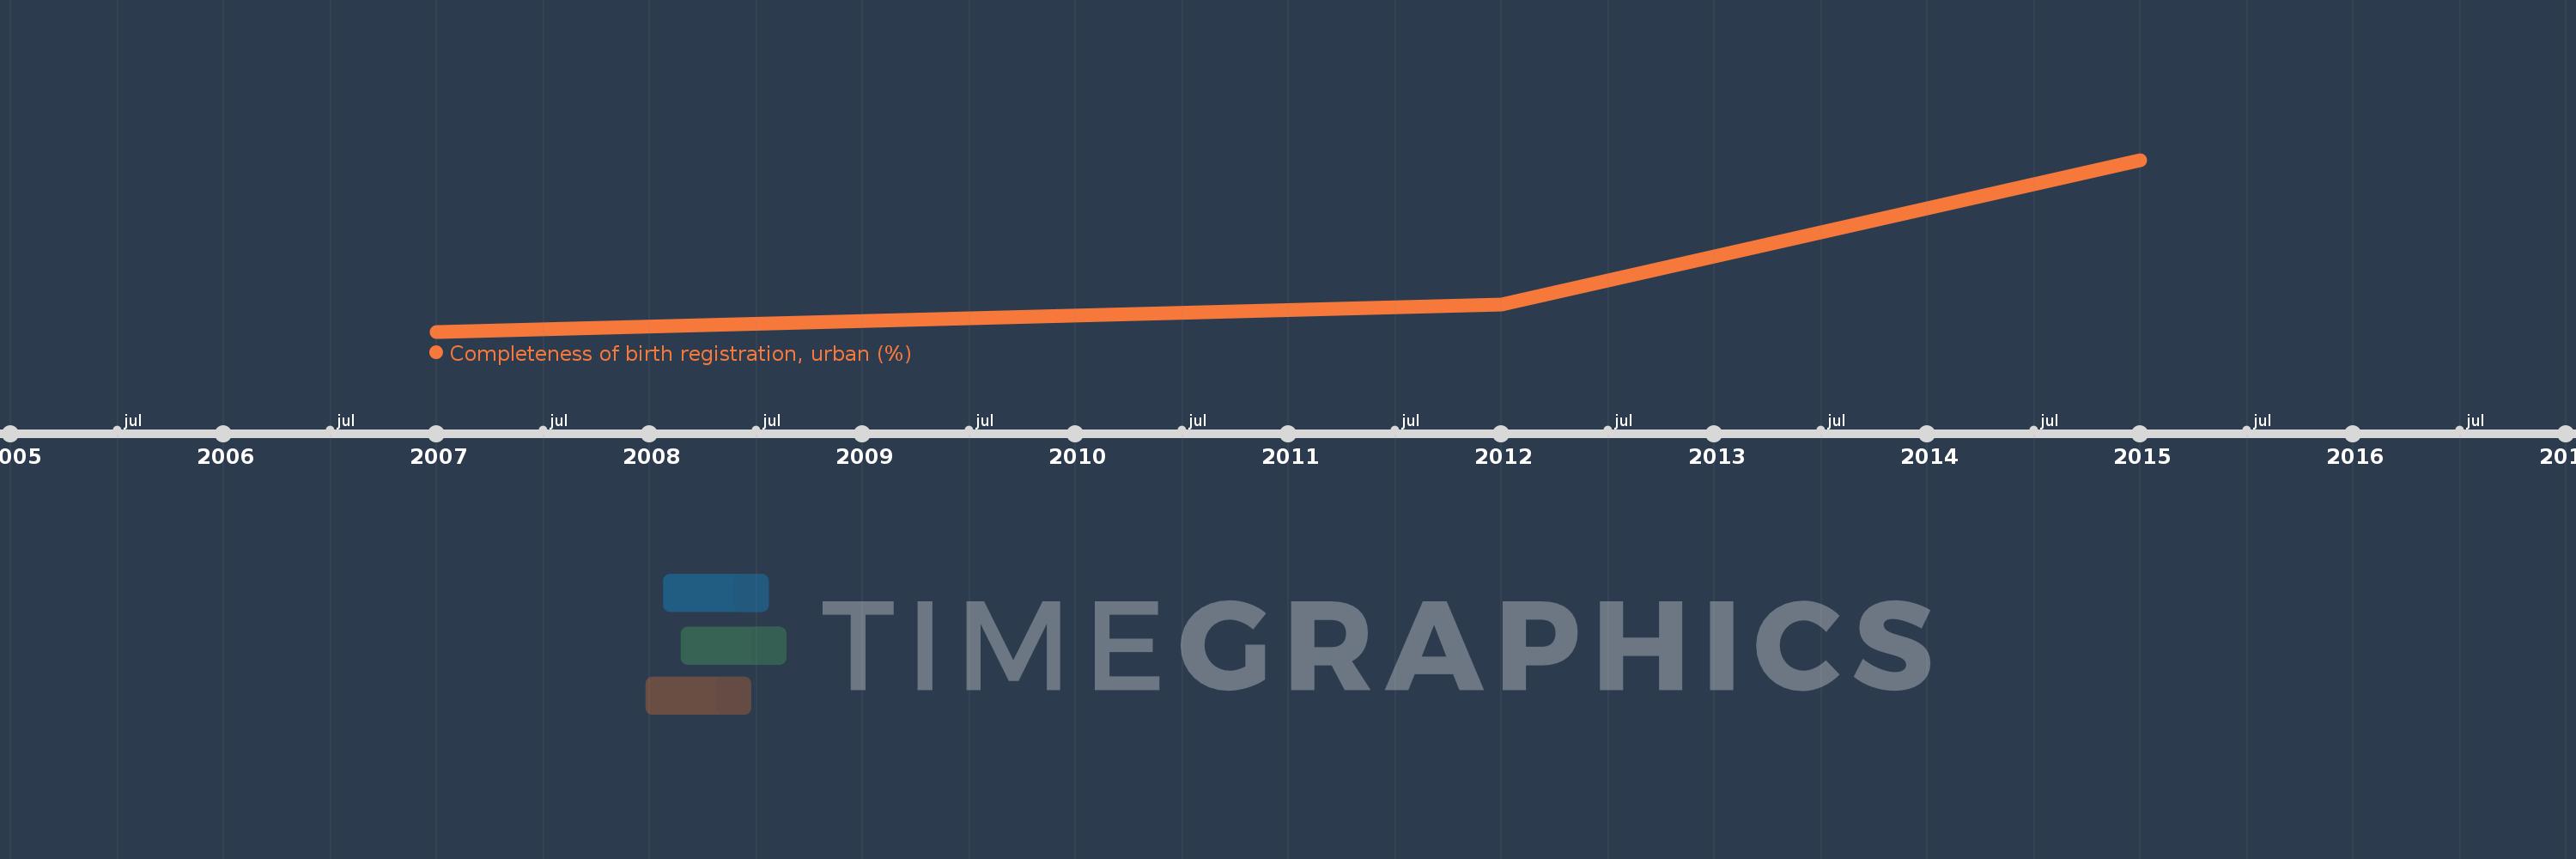
Completeness of birth registration, urban (%)
2015,2012,2007
This statistics in other country:
Timeline:
This timeline shows a graph from 2007 to 2015 of Nepal. No data until 2006. Number of actual observations by date: 3.
Source name:
World Development Indicators
Source organization:
UNICEF's State of the World's Children based mostly on household surveys and ministry of health data.
Categories, topics:
Health
Last updated:
apr 23, 2017
Indicators value changes by year
At the date of observation
Value
Absolute change
Change from previous value
jan 1, 2007
41.9
+41.9
0.0%
jan 1, 2012
44.2
+2.3
5.49%
jan 1, 2015
56.6
+12.4
28.05%
Ranking of countries by current statistics by years


Comments: