29
/
en
AIzaSyAYiBZKx7MnpbEhh9jyipgxe19OcubqV5w
April 1, 2024
200880
Montenegro
MNE
true
2
1
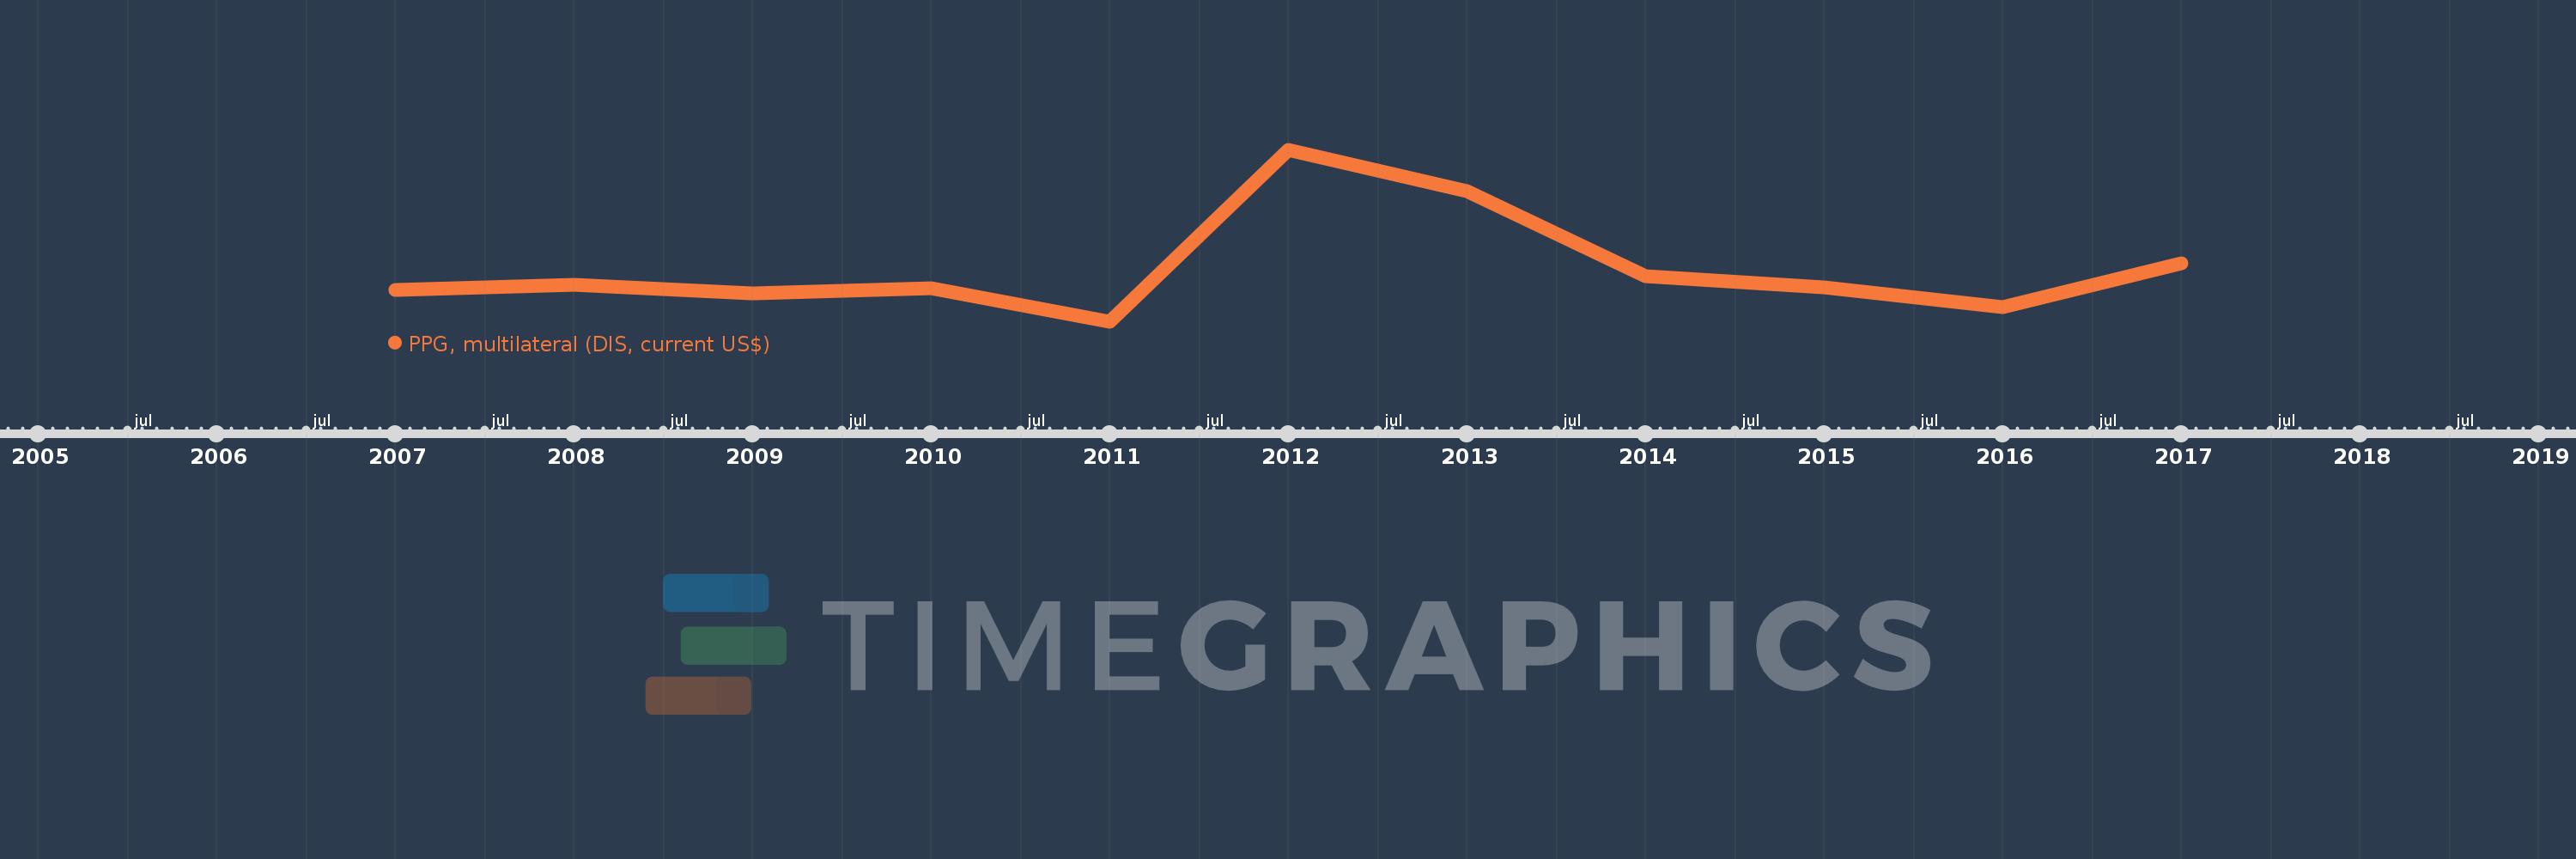
PPG, multilateral (DIS, current US$)
2017,2016,2015,2014,2013,2012,2011,2010,2009,2008,2007
This statistics in other country:
Timeline:
This timeline shows a graph from 2007 to 2017 of Montenegro. No data until 2006. Number of actual observations by date: 11.
Source name:
World Development Indicators
Source organization:
World Bank, International Debt Statistics.
Categories, topics:
External Debt
Last updated:
apr 23, 2017
Indicators value changes by year
Minimum:
10.957 mln
jan 1, 2011
Maximum:
167.151 mln
jan 1, 2012
At the date of observation
Value
Absolute change
Change from previous value
jan 1, 2007
39.877 mln
+39.877 mln
0.0%
jan 1, 2008
45.142 mln
+5.265 mln
13.2%
jan 1, 2009
36.709 mln
-8.433 mln
-18.68%
jan 1, 2010
41.392 mln
+4.683 mln
12.76%
jan 1, 2011
10.957 mln
-30.435 mln
-73.53%
jan 1, 2012
167.151 mln
+156.194 mln
1.43K%
jan 1, 2013
129.556 mln
-37.595 mln
-22.49%
jan 1, 2014
52.611 mln
-76.945 mln
-59.39%
jan 1, 2015
42.15 mln
-10.461 mln
-19.88%
jan 1, 2016
24.849 mln
-17.301 mln
-41.05%
jan 1, 2017
64.08 mln
+39.231 mln
157.88%
Ranking of countries by current statistics by years


Comments: