29
/
en
AIzaSyAYiBZKx7MnpbEhh9jyipgxe19OcubqV5w
April 1, 2024
200842
Montenegro
MNE
true
2
1
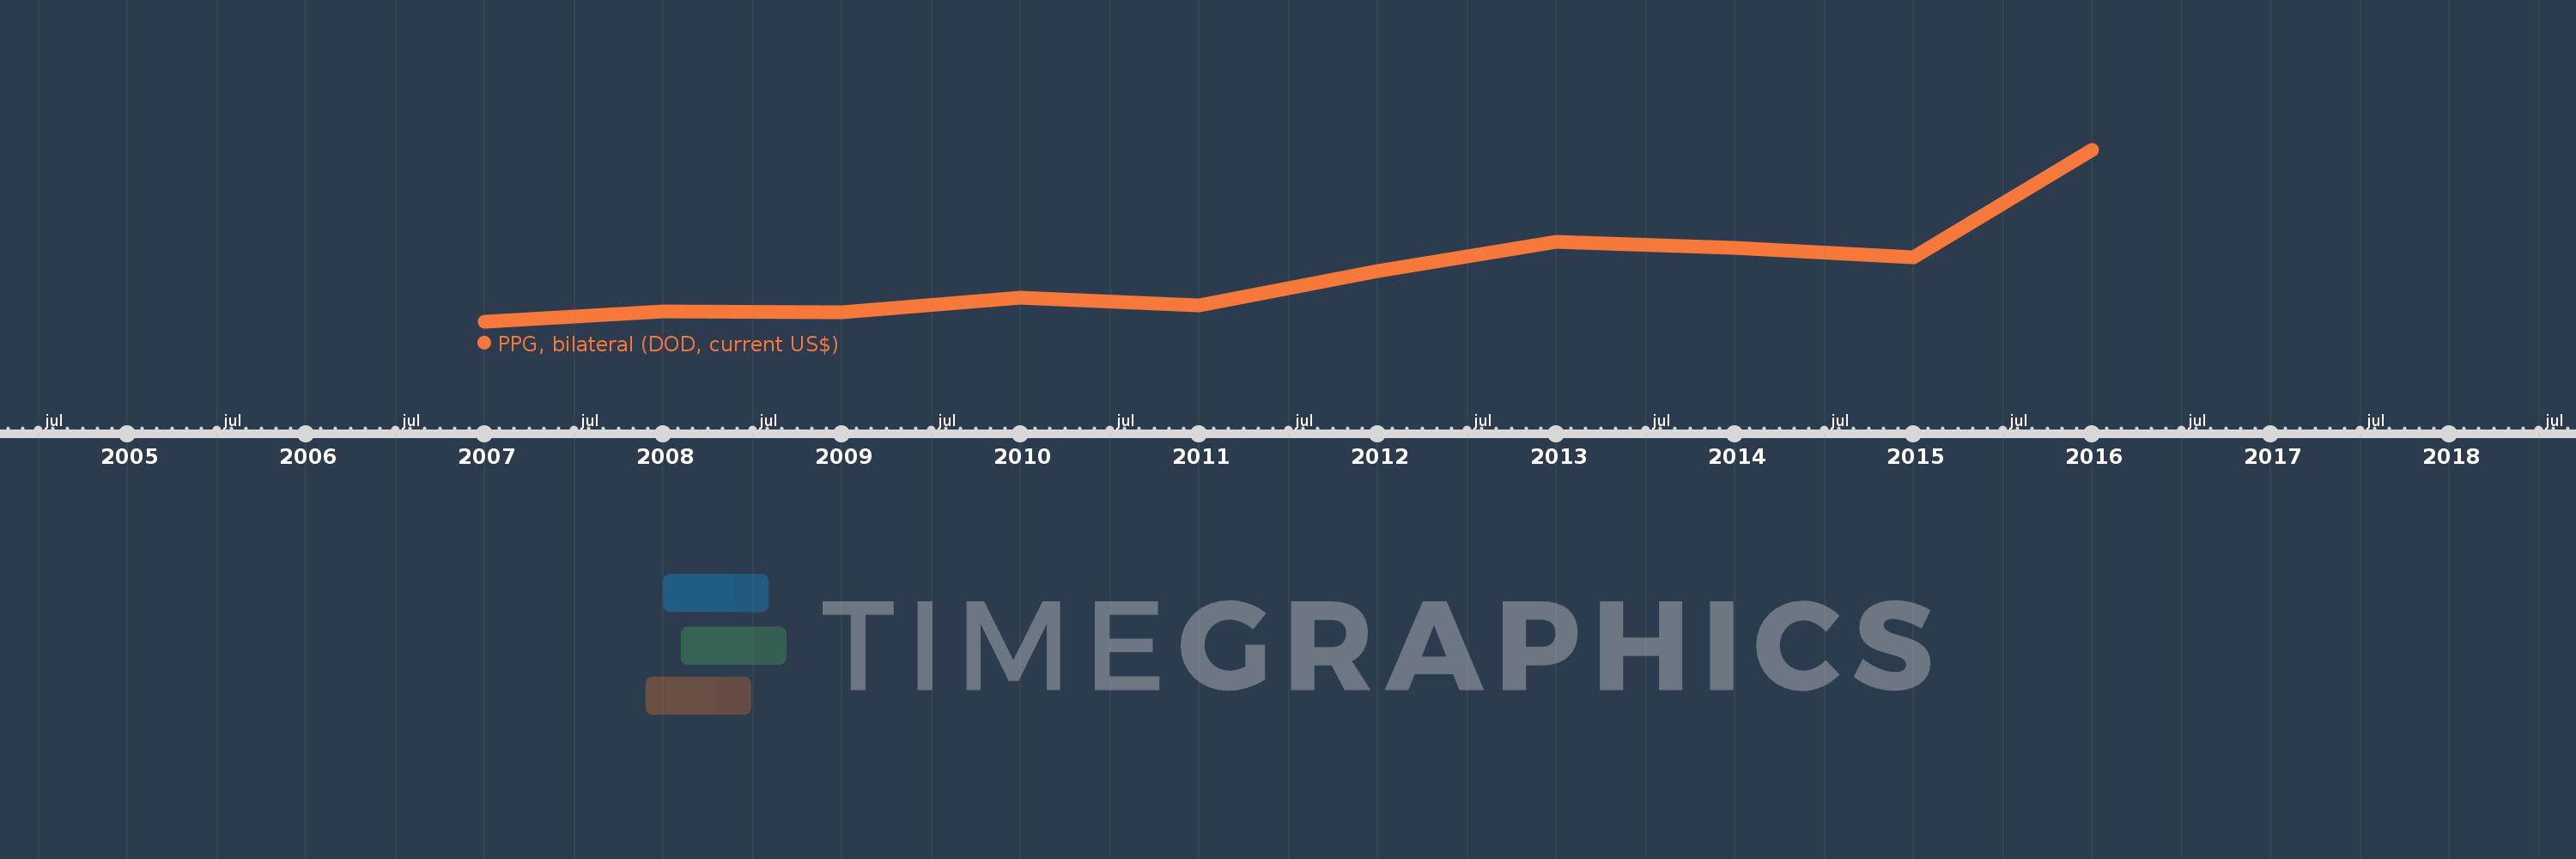
PPG, bilateral (DOD, current US$)
2016,2015,2014,2013,2012,2011,2010,2009,2008,2007
This statistics in other country:
Timeline:
This timeline shows a graph from 2007 to 2016 of Montenegro. No data until 2006. Number of actual observations by date: 10.
Source name:
World Development Indicators
Source organization:
World Bank, International Debt Statistics.
Categories, topics:
External Debt
Last updated:
apr 23, 2017
Indicators value changes by year
Minimum:
266.469 mln
jan 1, 2007
Maximum:
511.731 mln
jan 1, 2016
At the date of observation
Value
Absolute change
Change from previous value
jan 1, 2007
266.469 mln
+266.469 mln
0.0%
jan 1, 2008
281.191 mln
+14.722 mln
5.52%
jan 1, 2009
280.702 mln
-489.0K
-0.17%
jan 1, 2010
301.776 mln
+21.074 mln
7.51%
jan 1, 2011
290.105 mln
-11.671 mln
-3.87%
jan 1, 2012
338.735 mln
+48.63 mln
16.76%
jan 1, 2013
380.303 mln
+41.568 mln
12.27%
jan 1, 2014
372.409 mln
-7.894 mln
-2.08%
jan 1, 2015
359.139 mln
-13.27 mln
-3.56%
jan 1, 2016
511.731 mln
+152.592 mln
42.49%
Ranking of countries by current statistics by years


Comments: