29
/
en
AIzaSyAYiBZKx7MnpbEhh9jyipgxe19OcubqV5w
April 1, 2024
200759
Montenegro
MNE
true
2
1
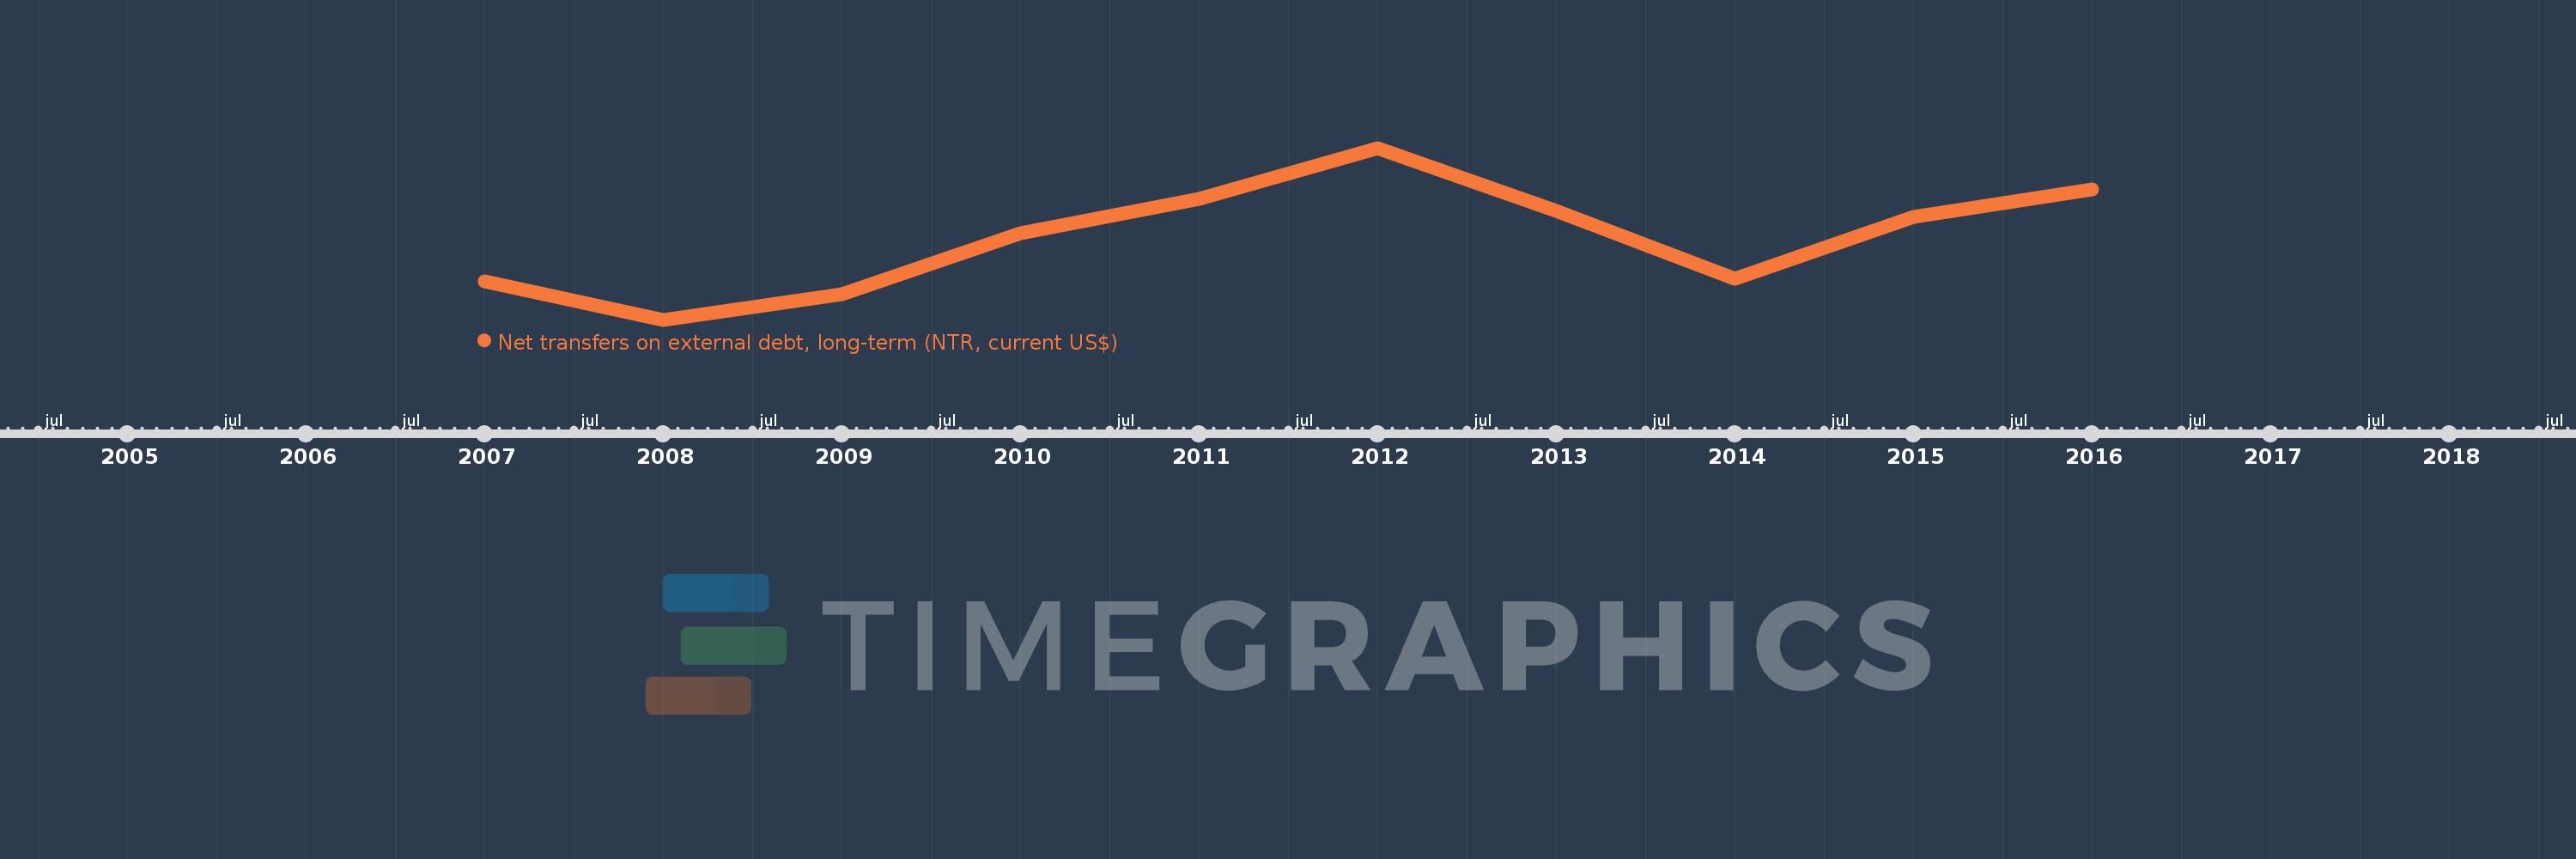
Net transfers on external debt, long-term (NTR, current US$)
2016,2015,2014,2013,2012,2011,2010,2009,2008,2007
This statistics in other country:
Timeline:
This timeline shows a graph from 2007 to 2016 of Montenegro. No data until 2006. Number of actual observations by date: 10.
Source name:
World Development Indicators
Source organization:
World Bank, International Debt Statistics.
Categories, topics:
External Debt
Last updated:
apr 23, 2017
Indicators value changes by year
Minimum:
-70.353 mln
jan 1, 2008
Maximum:
457.455 mln
jan 1, 2012
At the date of observation
Value
Absolute change
Change from previous value
jan 1, 2007
47.139 mln
+47.139 mln
0.0%
jan 1, 2008
-70.353 mln
-117.492 mln
-249.25%
jan 1, 2009
7.918 mln
+78.271 mln
-111.25%
jan 1, 2010
195.054 mln
+187.136 mln
2.36K%
jan 1, 2011
299.858 mln
+104.804 mln
53.73%
jan 1, 2012
457.455 mln
+157.597 mln
52.56%
jan 1, 2013
264.666 mln
-192.789 mln
-42.14%
jan 1, 2014
54.755 mln
-209.911 mln
-79.31%
jan 1, 2015
246.808 mln
+192.053 mln
350.75%
jan 1, 2016
329.258 mln
+82.45 mln
33.41%
Ranking of countries by current statistics by years


Comments: