29
/
en
AIzaSyAYiBZKx7MnpbEhh9jyipgxe19OcubqV5w
April 1, 2024
199673
Mongolia
MNG
true
2
1
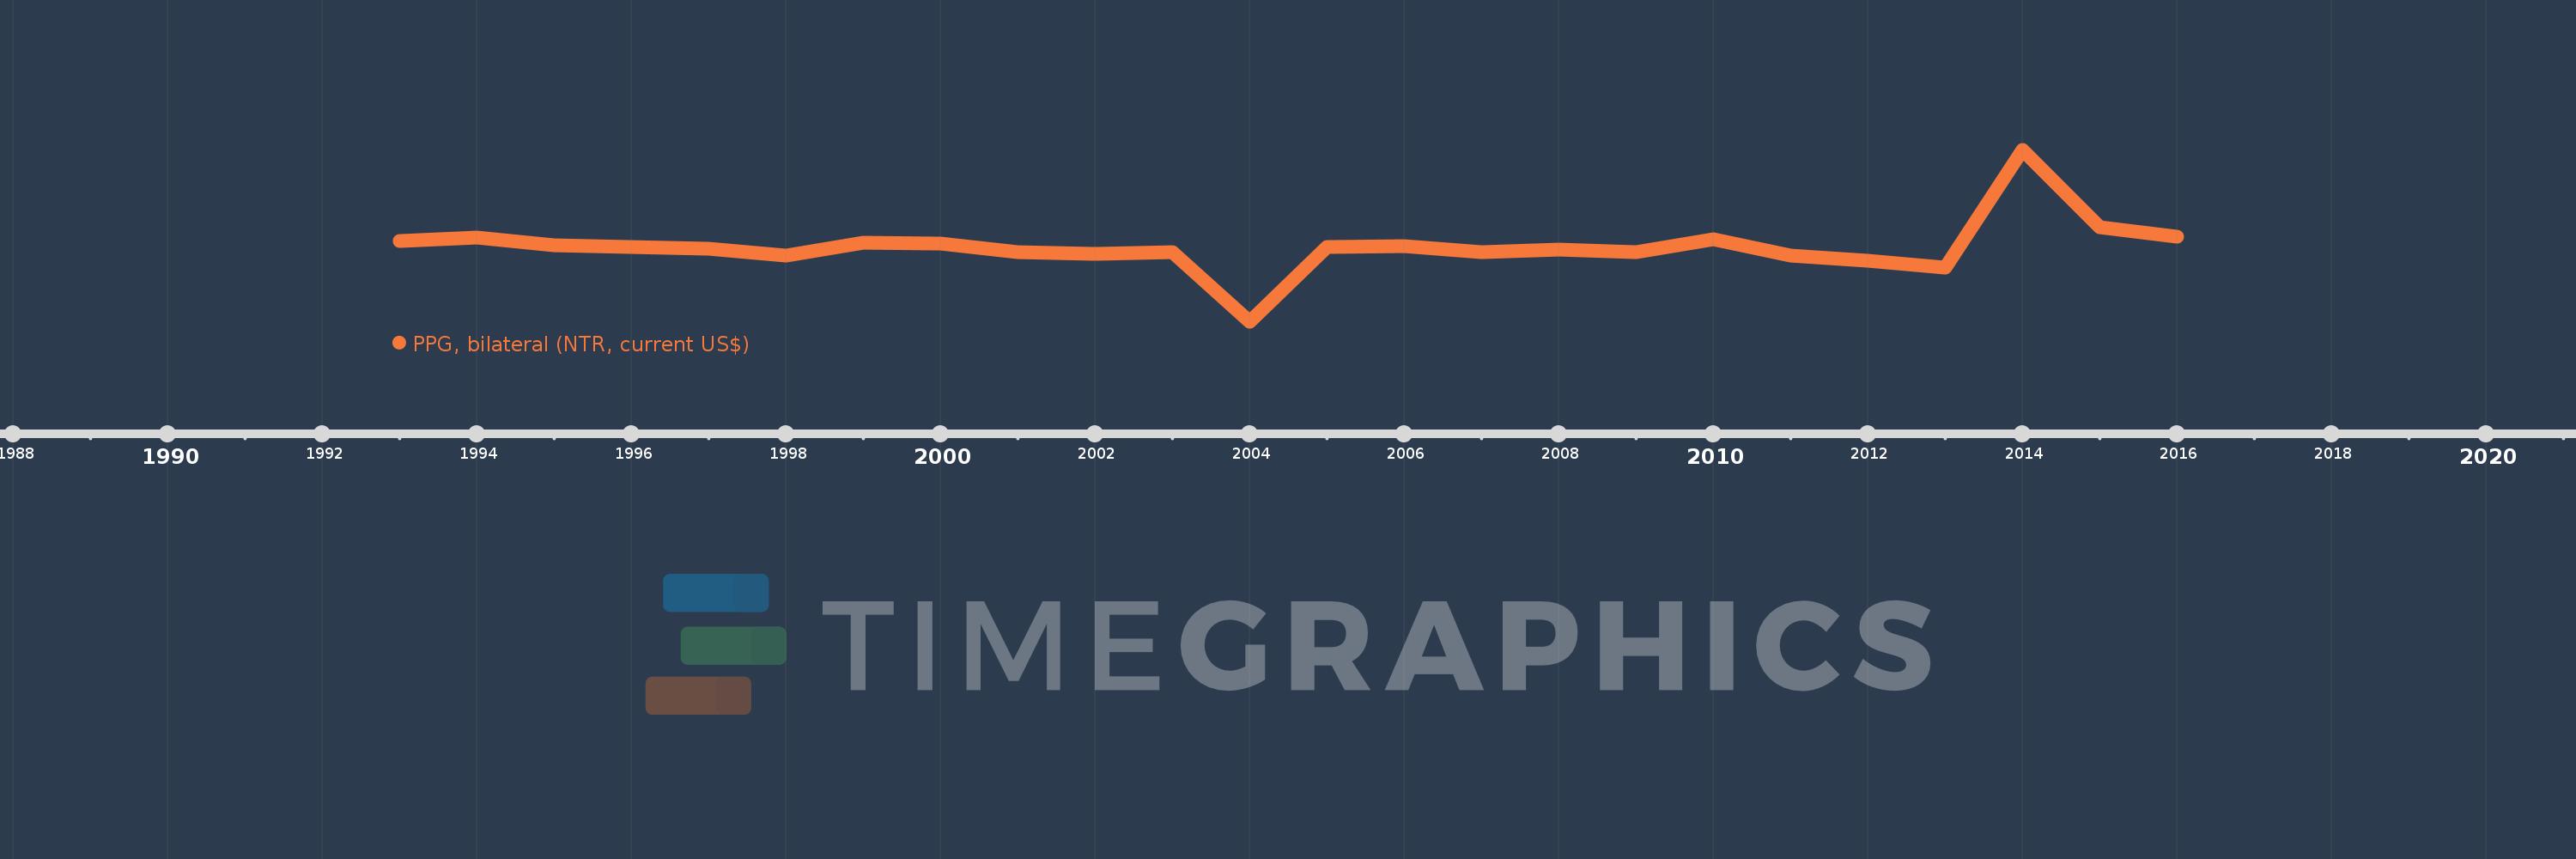
PPG, bilateral (NTR, current US$)
2016,2015,2014,2013,2012,2011,2010,2009,2008,2007,2006,2005,2004,2003,2002,2001,2000,1999,1998,1997,1996,1995,1994,1993
This statistics in other country:
Timeline:
This timeline shows a graph from 1993 to 2016 of Mongolia. No data until 1992. Number of actual observations by date: 24.
Source name:
World Development Indicators
Source organization:
World Bank, International Debt Statistics.
Categories, topics:
External Debt
Last updated:
apr 23, 2017
Indicators value changes by year
Minimum:
-231.351 mln
jan 1, 2004
Maximum:
344.066 mln
jan 1, 2014
At the date of observation
Value
Absolute change
Change from previous value
jan 1, 1993
41.381 mln
+41.381 mln
0.0%
jan 1, 1994
52.078 mln
+10.697 mln
25.85%
jan 1, 1995
24.959 mln
-27.119 mln
-52.07%
jan 1, 1996
20.234 mln
-4.725 mln
-18.93%
jan 1, 1997
13.08 mln
-7.154 mln
-35.36%
jan 1, 1998
-9.902 mln
-22.982 mln
-175.7%
jan 1, 1999
35.002 mln
+44.904 mln
-453.48%
jan 1, 2000
32.196 mln
-2.806 mln
-8.02%
jan 1, 2001
3.846 mln
-28.35 mln
-88.05%
jan 1, 2002
-4.51 mln
-8.356 mln
-217.26%
jan 1, 2003
2.225 mln
+6.735 mln
-149.33%
jan 1, 2004
-231.351 mln
-233.576 mln
-10.5K%
jan 1, 2005
19.829 mln
+251.18 mln
-108.57%
jan 1, 2006
23.987 mln
+4.158 mln
20.97%
jan 1, 2007
3.41 mln
-20.577 mln
-85.78%
jan 1, 2008
10.583 mln
+7.173 mln
210.35%
jan 1, 2009
1.634 mln
-8.949 mln
-84.56%
jan 1, 2010
46.976 mln
+45.342 mln
2.77K%
jan 1, 2011
-7.635 mln
-54.611 mln
-116.25%
jan 1, 2012
-26.259 mln
-18.624 mln
243.93%
jan 1, 2013
-50.627 mln
-24.368 mln
92.8%
jan 1, 2014
344.066 mln
+394.693 mln
-779.61%
jan 1, 2015
86.972 mln
-257.094 mln
-74.72%
jan 1, 2016
54.581 mln
-32.391 mln
-37.24%
Ranking of countries by current statistics by years


Comments: