29
/
en
AIzaSyAYiBZKx7MnpbEhh9jyipgxe19OcubqV5w
April 1, 2024
198938
Mongolia
MNG
true
2
1
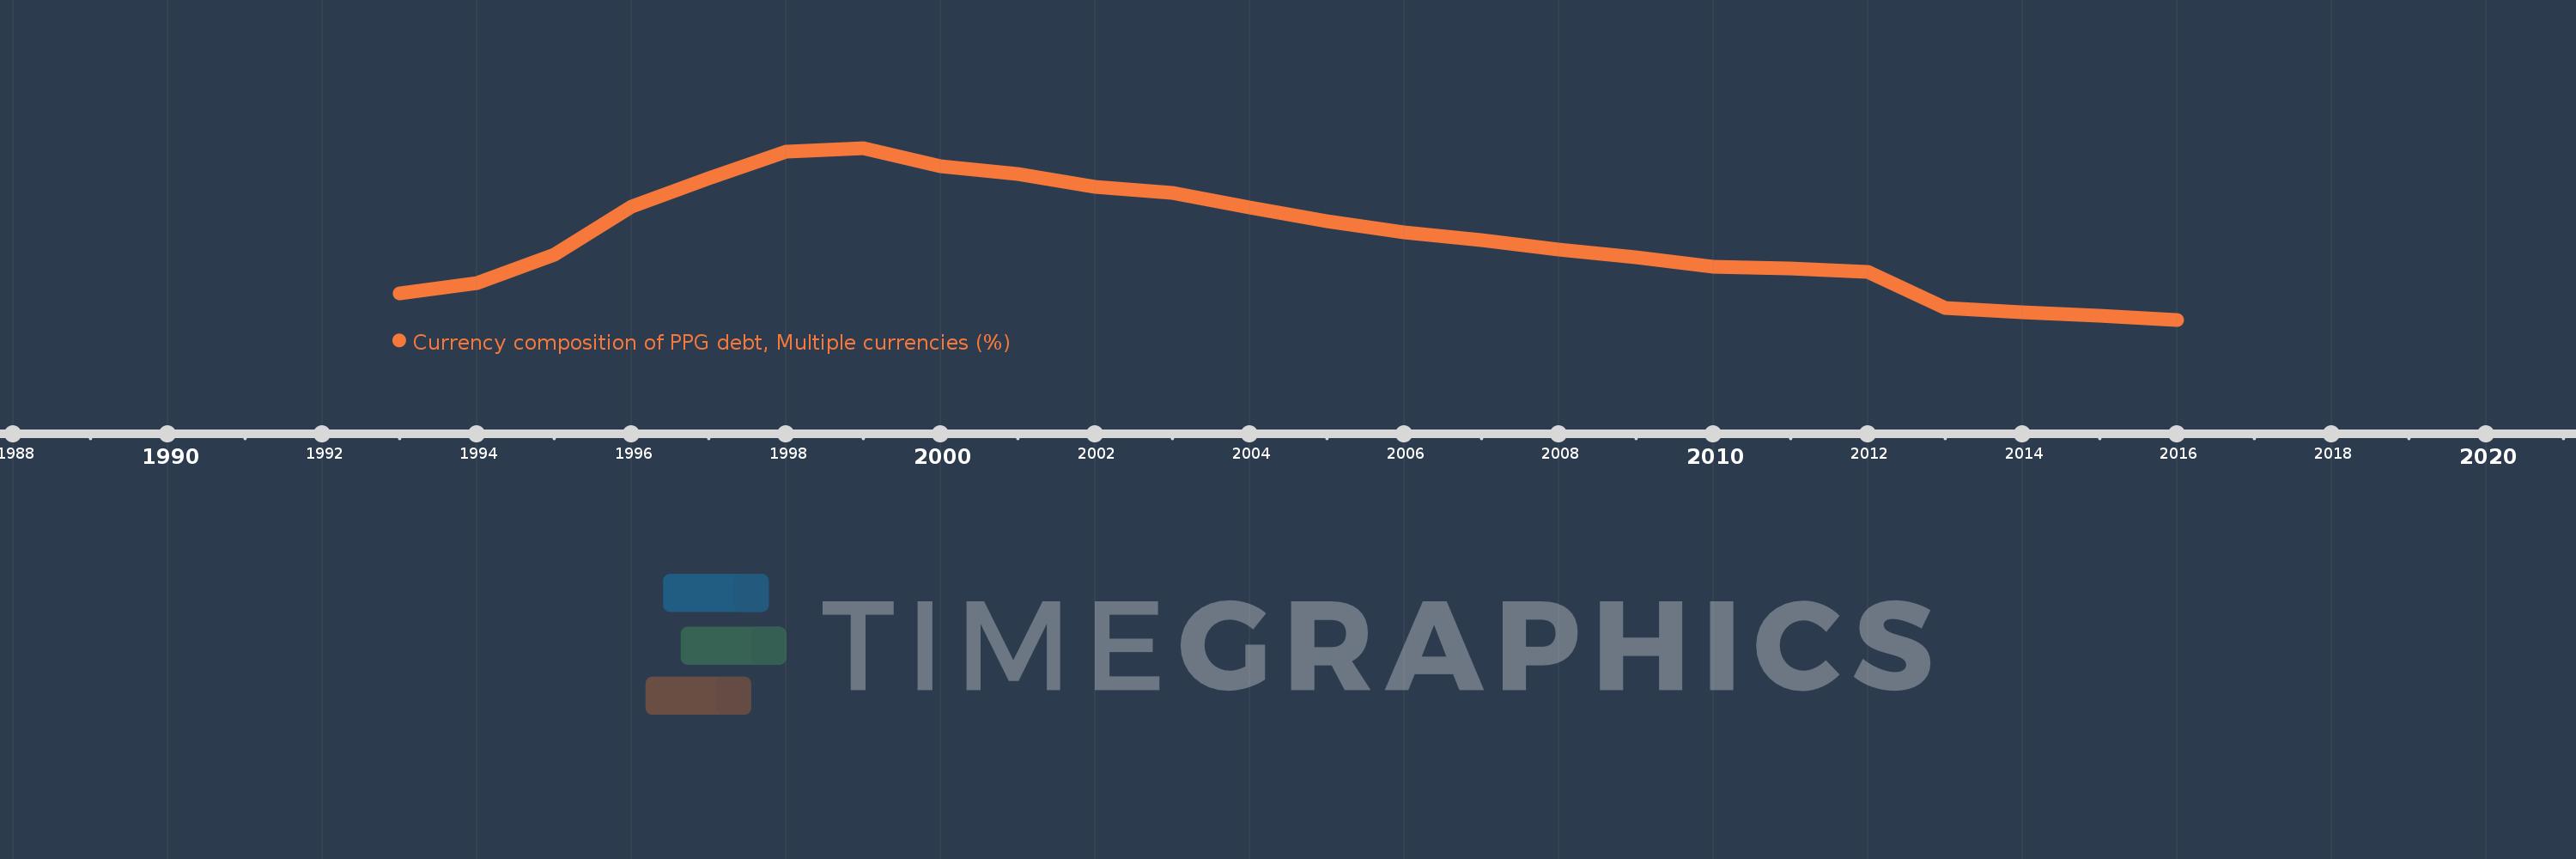
Currency composition of PPG debt, Multiple currencies (%)
2016,2015,2014,2013,2012,2011,2010,2009,2008,2007,2006,2005,2004,2003,2002,2001,2000,1999,1998,1997,1996,1995,1994,1993
This statistics in other country:
Timeline:
This timeline shows a graph from 1993 to 2016 of Mongolia. No data until 1992. Number of actual observations by date: 24.
Source name:
World Development Indicators
Source organization:
World Bank, International Debt Statistics.
Categories, topics:
External Debt
Last updated:
apr 23, 2017
Indicators value changes by year
Maximum:
33.131
jan 1, 1999
At the date of observation
Value
Absolute change
Change from previous value
jan 1, 1993
9.395
+9.395
0.0%
jan 1, 1994
11.194
+1.799
19.14%
jan 1, 1995
15.73
+4.537
40.53%
jan 1, 1996
23.546
+7.815
49.68%
jan 1, 1997
28.142
+4.596
19.52%
jan 1, 1998
32.54
+4.398
15.63%
jan 1, 1999
33.131
+0.591
1.81%
jan 1, 2000
30.142
-2.988
-9.02%
jan 1, 2001
28.951
-1.192
-3.95%
jan 1, 2002
26.73
-2.221
-7.67%
jan 1, 2003
25.803
-0.926
-3.47%
jan 1, 2004
23.373
-2.431
-9.42%
jan 1, 2005
21.201
-2.171
-9.29%
jan 1, 2006
19.405
-1.797
-8.47%
jan 1, 2007
18.055
-1.35
-6.96%
jan 1, 2008
16.525
-1.53
-8.47%
jan 1, 2009
15.339
-1.186
-7.18%
jan 1, 2010
13.806
-1.533
-9.99%
jan 1, 2011
13.569
-0.236
-1.71%
jan 1, 2012
12.9
-0.669
-4.93%
jan 1, 2013
7.077
-5.823
-45.14%
jan 1, 2014
6.309
-0.769
-10.86%
jan 1, 2015
5.789
-0.52
-8.24%
jan 1, 2016
5.158
-0.631
-10.89%
Ranking of countries by current statistics by years


Comments: