29
/
en
AIzaSyAYiBZKx7MnpbEhh9jyipgxe19OcubqV5w
April 1, 2024
183980
Macedonia, FYR
MKD
true
2
1
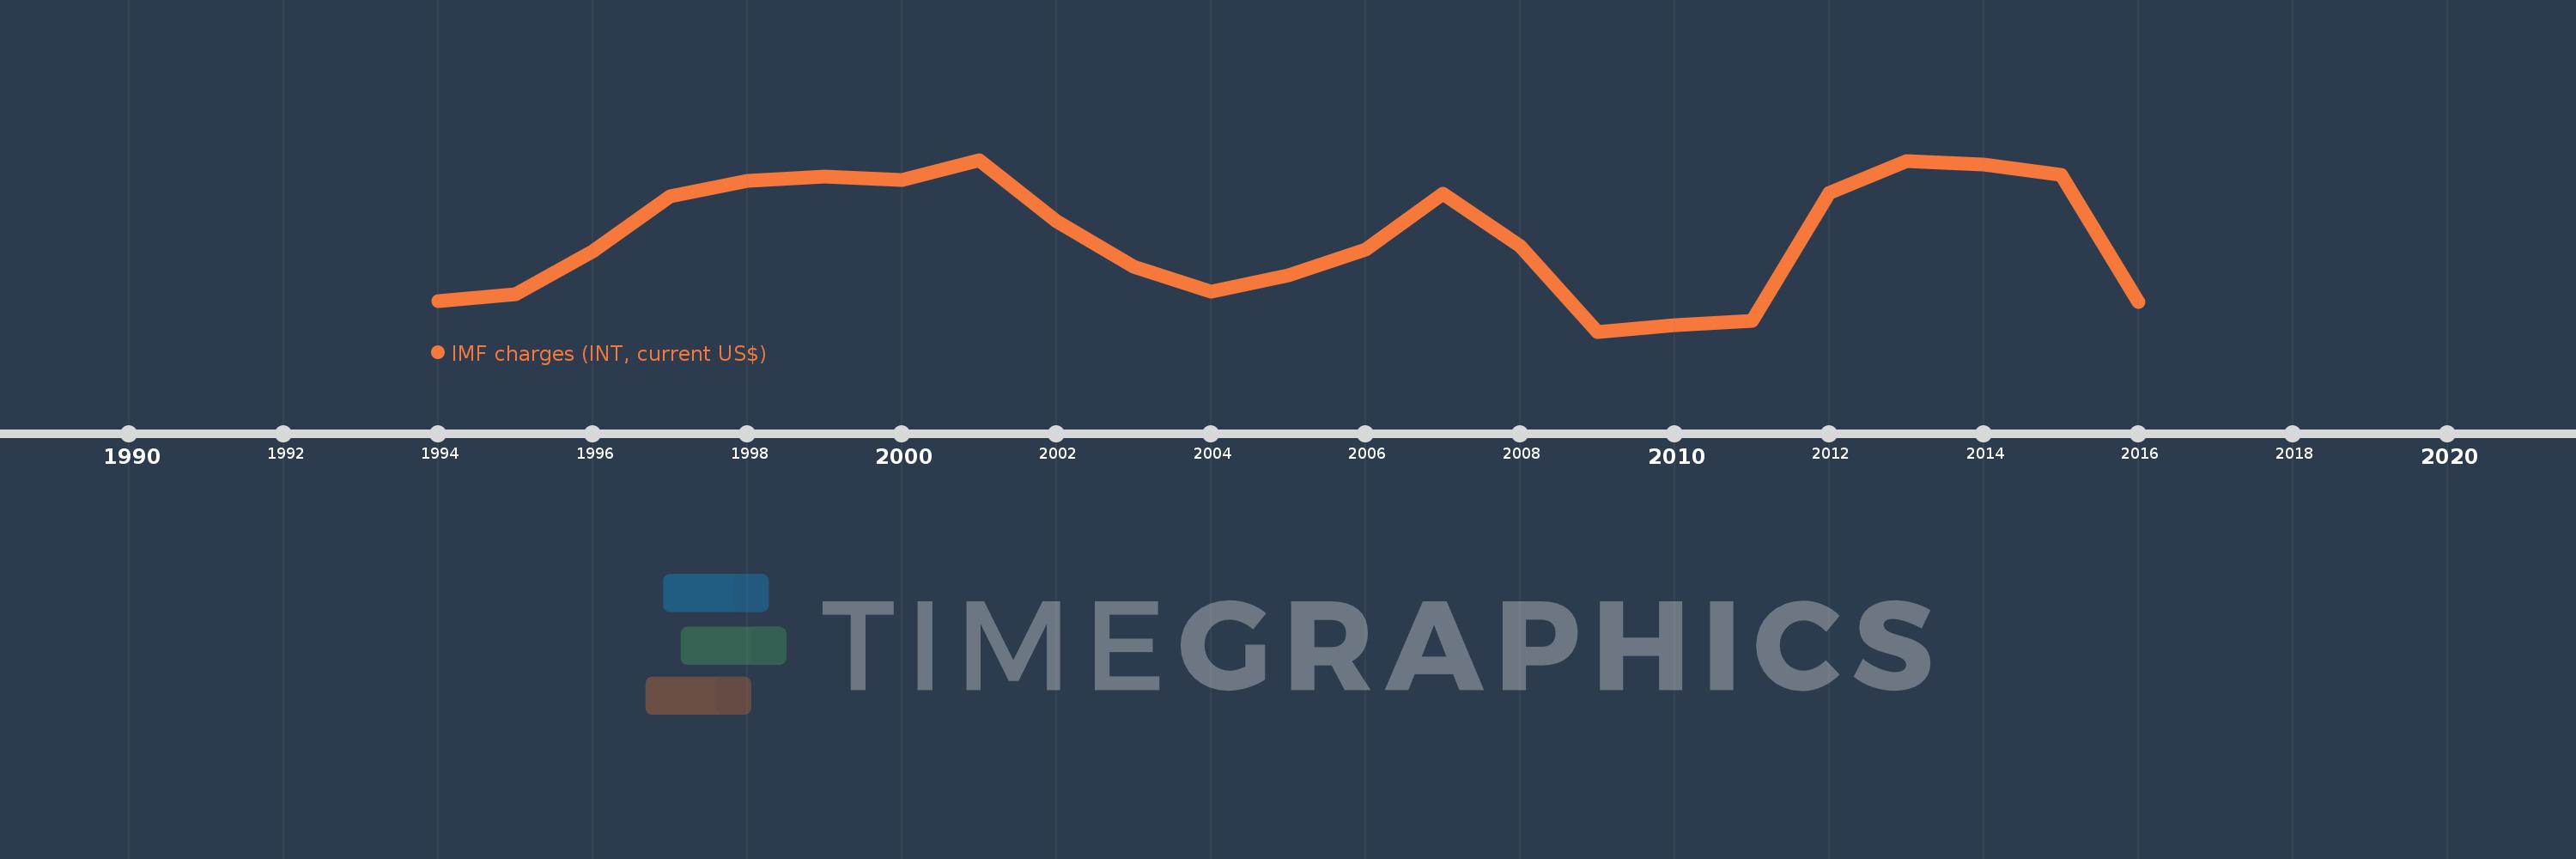
IMF charges (INT, current US$)
2016,2015,2014,2013,2012,2011,2010,2009,2008,2007,2006,2005,2004,2003,2002,2001,2000,1999,1998,1997,1996,1995,1994
This statistics in other country:
Timeline:
This timeline shows a graph from 1994 to 2016 of Macedonia, FYR. No data until 1993. Number of actual observations by date: 23.
Source name:
World Development Indicators
Source organization:
World Bank, International Debt Statistics.
Categories, topics:
External Debt
Last updated:
apr 23, 2017
Indicators value changes by year
Minimum:
106.0K
jan 1, 2009
Maximum:
3.455 mln
jan 1, 2001
At the date of observation
Value
Absolute change
Change from previous value
jan 1, 1994
693.0K
+693.0K
0.0%
jan 1, 1995
841.0K
+148.0K
21.36%
jan 1, 1996
1.68 mln
+839.0K
99.76%
jan 1, 1997
2.738 mln
+1.058 mln
62.98%
jan 1, 1998
3.037 mln
+299.0K
10.92%
jan 1, 1999
3.128 mln
+91.0K
3.0%
jan 1, 2000
3.065 mln
-63.0K
-2.01%
jan 1, 2001
3.455 mln
+390.0K
12.72%
jan 1, 2002
2.266 mln
-1.189 mln
-34.41%
jan 1, 2003
1.373 mln
-893.0K
-39.41%
jan 1, 2004
878.0K
-495.0K
-36.05%
jan 1, 2005
1.208 mln
+330.0K
37.59%
jan 1, 2006
1.703 mln
+495.0K
40.98%
jan 1, 2007
2.794 mln
+1.091 mln
64.06%
jan 1, 2008
1.774 mln
-1.02 mln
-36.51%
jan 1, 2009
106.0K
-1.668 mln
-94.02%
jan 1, 2010
237.0K
+131.0K
123.58%
jan 1, 2011
323.0K
+86.0K
36.29%
jan 1, 2012
2.803 mln
+2.48 mln
767.8%
jan 1, 2013
3.424 mln
+621.0K
22.15%
jan 1, 2014
3.364 mln
-60.0K
-1.75%
jan 1, 2015
3.163 mln
-201.0K
-5.98%
jan 1, 2016
691.0K
-2.472 mln
-78.15%
Ranking of countries by current statistics by years


Comments: