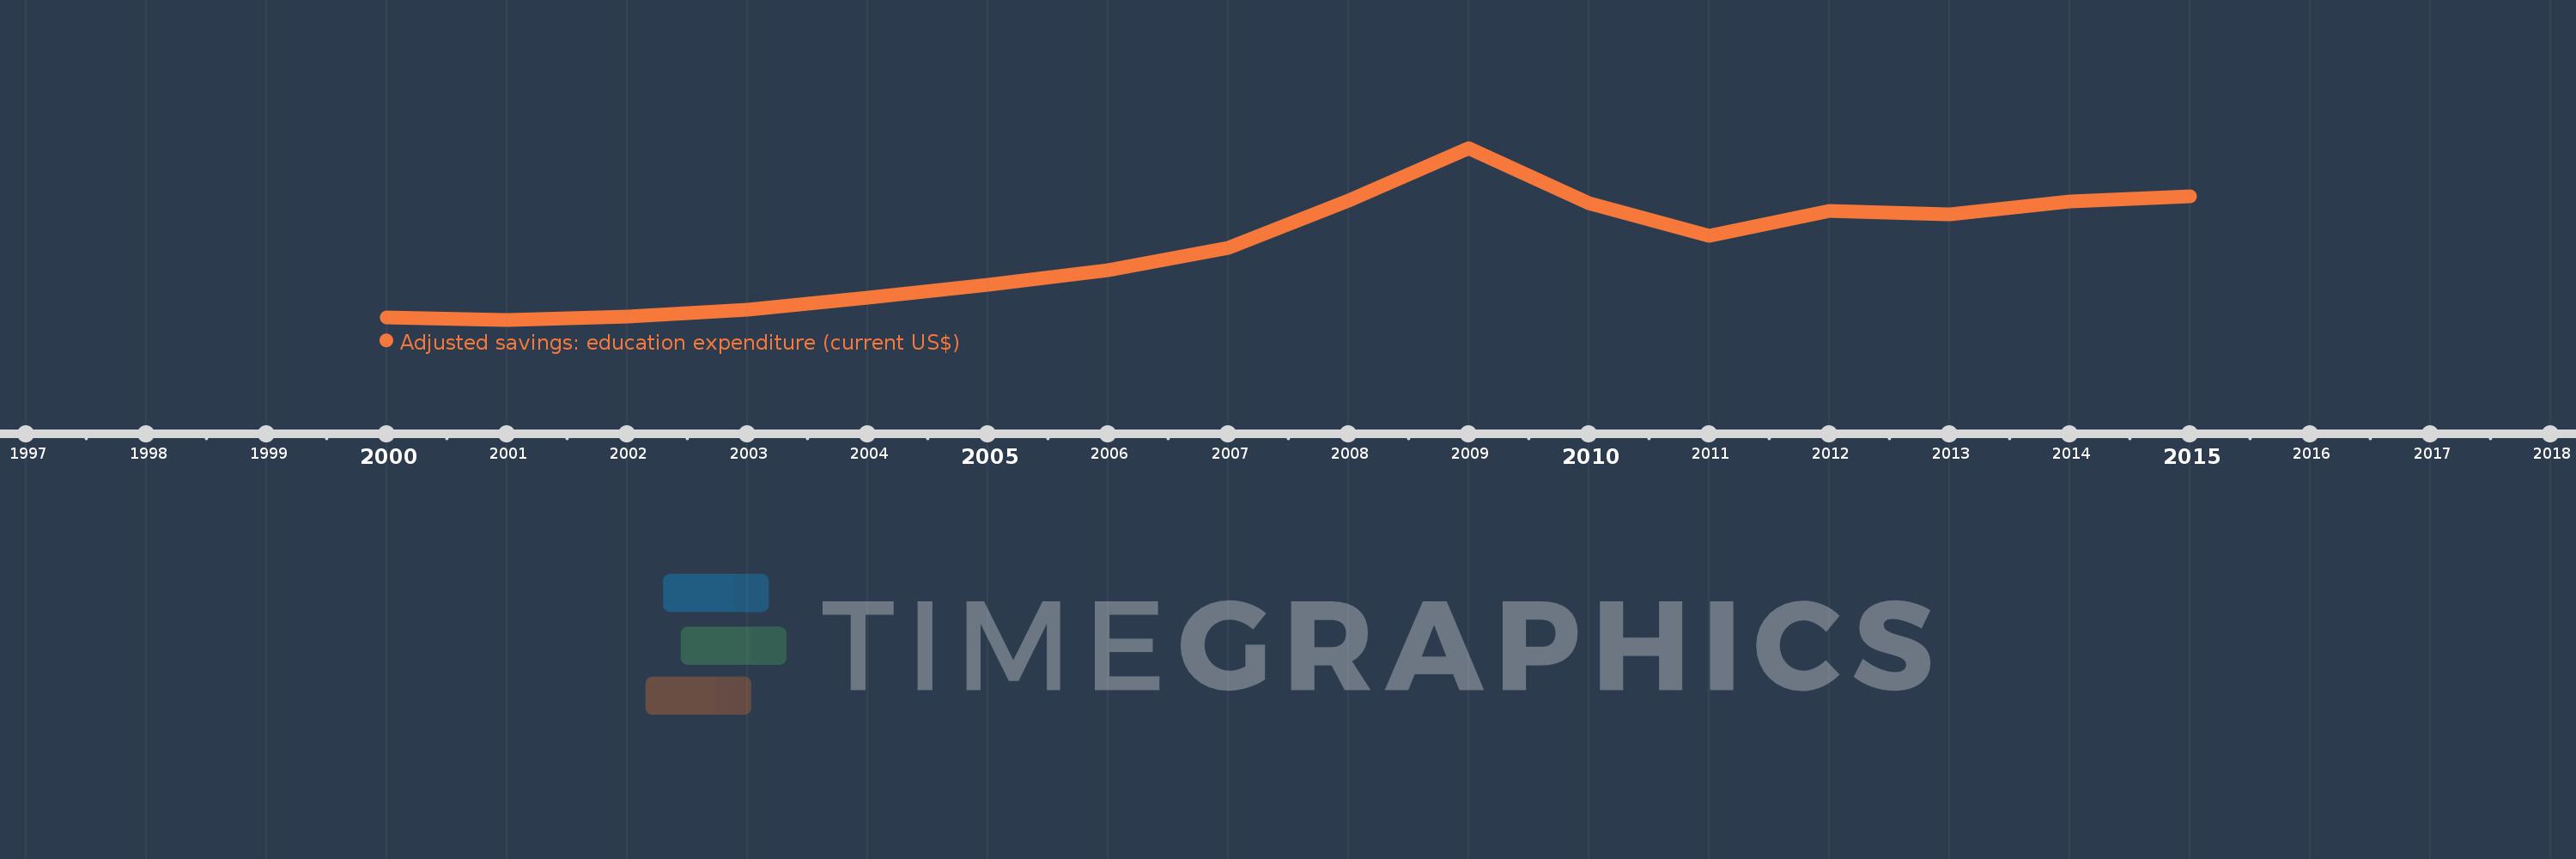
This timeline shows a graph from 2000 to 2015 of Latvia. No data until 1999. Number of actual observations by date: 16.
Source name:
World Development Indicators
Source organization:
World Bank staff estimates using data from the United Nations Statistics Division's Statistical Yearbook, and the UNESCO Institute for Statistics online database.
Categories, topics:
Economy & Growth, Environment
Last updated:
apr 23, 2017
Indicators value changes by year
Meaning:
944.094 mln
Minimum:
400.442 mln
jan 1, 2001
Maximum:
1.71 bln
jan 1, 2009
At the date of observation
Value
Absolute change
Change from the previous value
jan 1, 2000
415.648 mln
+415.648 mln
0.0%
jan 1, 2001
400.442 mln
-15.206 mln
-3.66%
jan 1, 2002
425.835 mln
+25.393 mln
6.34%
jan 1, 2003
474.221 mln
+48.386 mln
11.36%
jan 1, 2004
569.19 mln
+94.969 mln
20.03%
jan 1, 2005
667.157 mln
+97.966 mln
17.21%
jan 1, 2006
776.136 mln
+108.979 mln
16.33%
jan 1, 2007
949.471 mln
+173.335 mln
22.33%
jan 1, 2008
1.306 bln
+356.051 mln
37.5%
jan 1, 2009
1.71 bln
+404.277 mln
30.97%
jan 1, 2010
1.287 bln
-423.138 mln
-24.75%
jan 1, 2011
1.043 bln
-243.903 mln
-18.96%
jan 1, 2012
1.229 bln
+185.85 mln
17.82%
jan 1, 2013
1.206 bln
-22.701 mln
-1.85%
jan 1, 2014
1.305 bln
+98.945 mln
8.21%
jan 1, 2015
1.343 bln
+38.443 mln
2.95%
Ranking of countries by current statistics by years
