29
/
en
AIzaSyAYiBZKx7MnpbEhh9jyipgxe19OcubqV5w
April 1, 2024
174246
Lao PDR
LAO
true
2
1
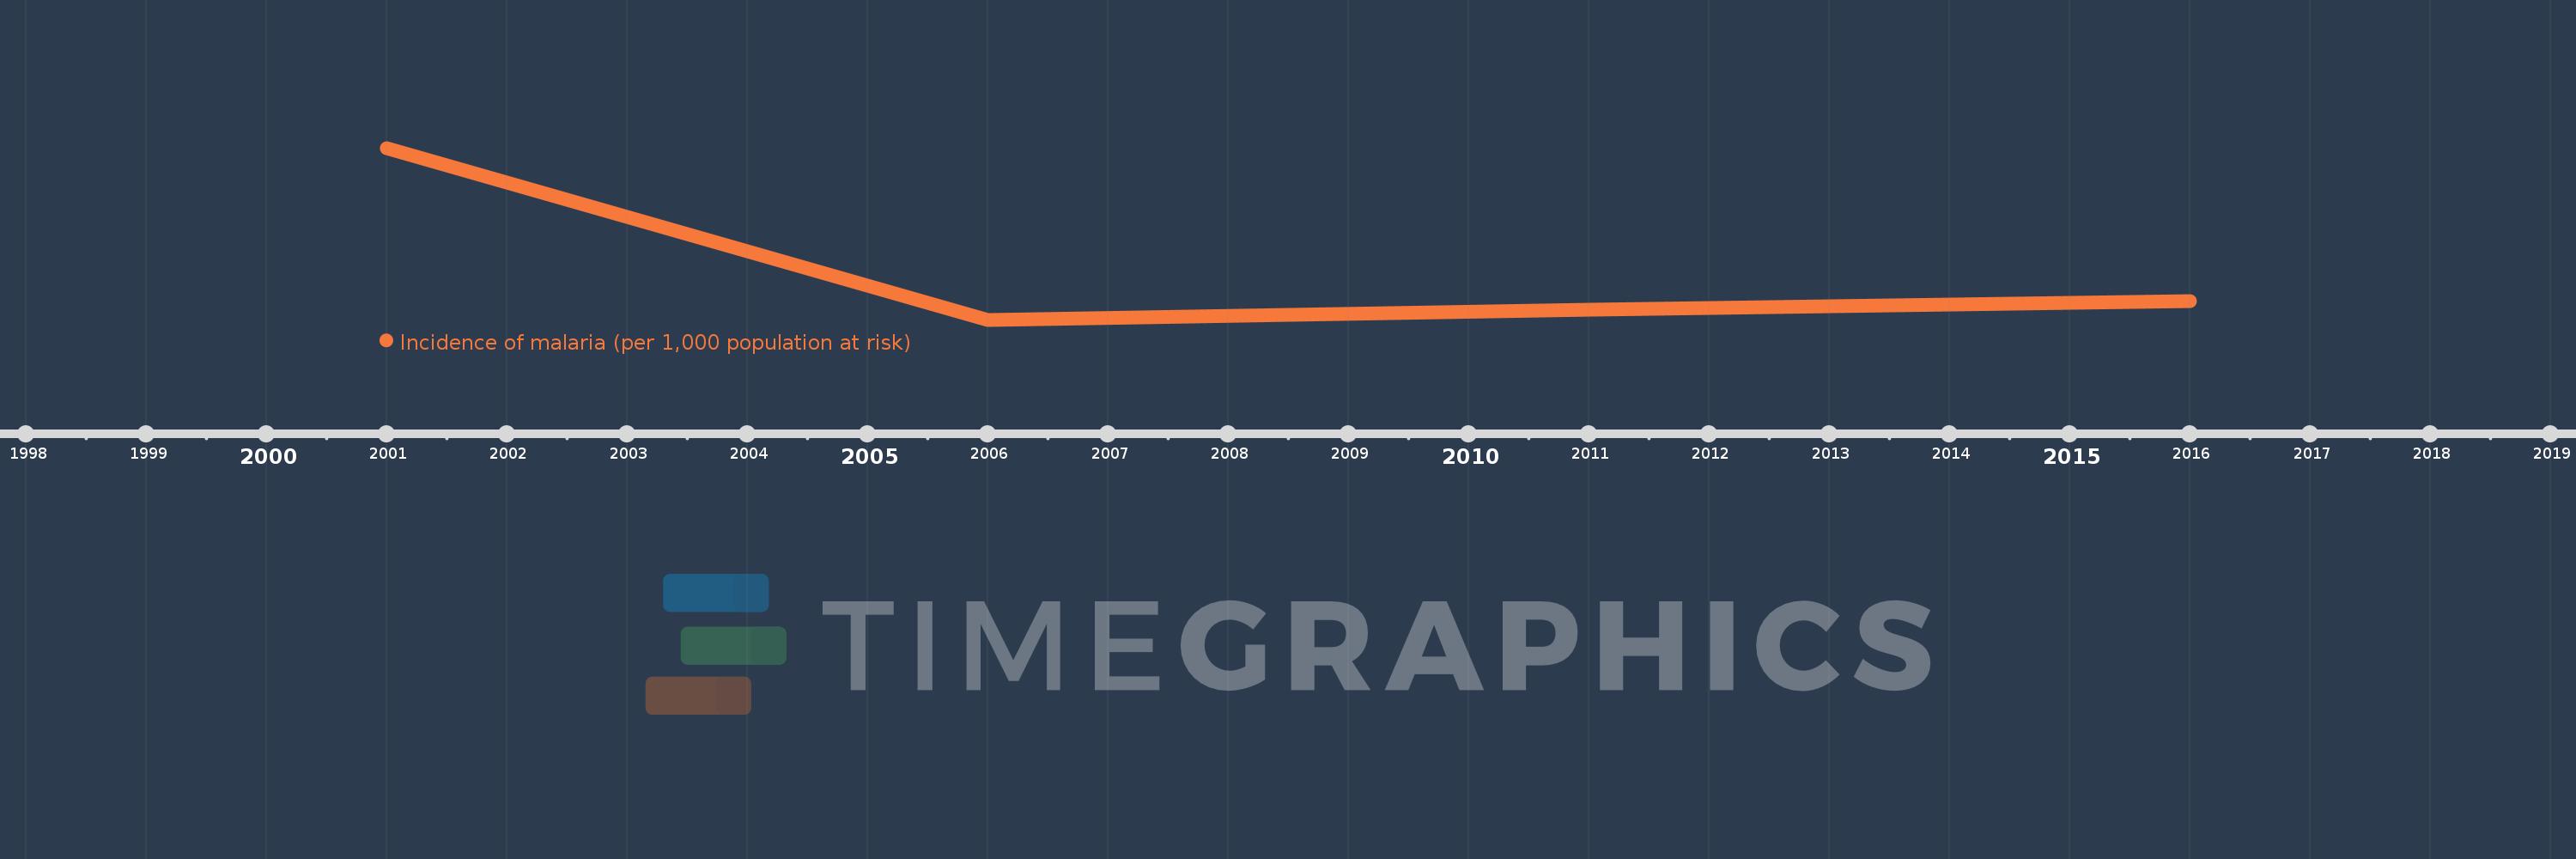
Incidence of malaria (per 1,000 population at risk)
2016,2011,2006,2001
This statistics in other country:
Timeline:
This timeline shows a graph from 2001 to 2016 of Lao PDR. No data until 2000. Number of actual observations by date: 4.
Source name:
World Development Indicators
Source organization:
World Health Organization, Global Health Observatory Data Repository/World Health Statistics (http://apps.who.int/ghodata/).
Categories, topics:
Health
Last updated:
apr 23, 2017
Indicators value changes by year
At the date of observation
Value
Absolute change
Change from previous value
jan 1, 2001
77.5
+77.5
0.0%
jan 1, 2006
14.0
-63.5
-81.94%
jan 1, 2011
17.8
+3.8
27.14%
jan 1, 2016
20.9
+3.1
17.42%
Ranking of countries by current statistics by years


Comments: