30
/
AIzaSyAYiBZKx7MnpbEhh9jyipgxe19OcubqV5w
April 1, 2024
167192
Kenya
KEN
true
2
1
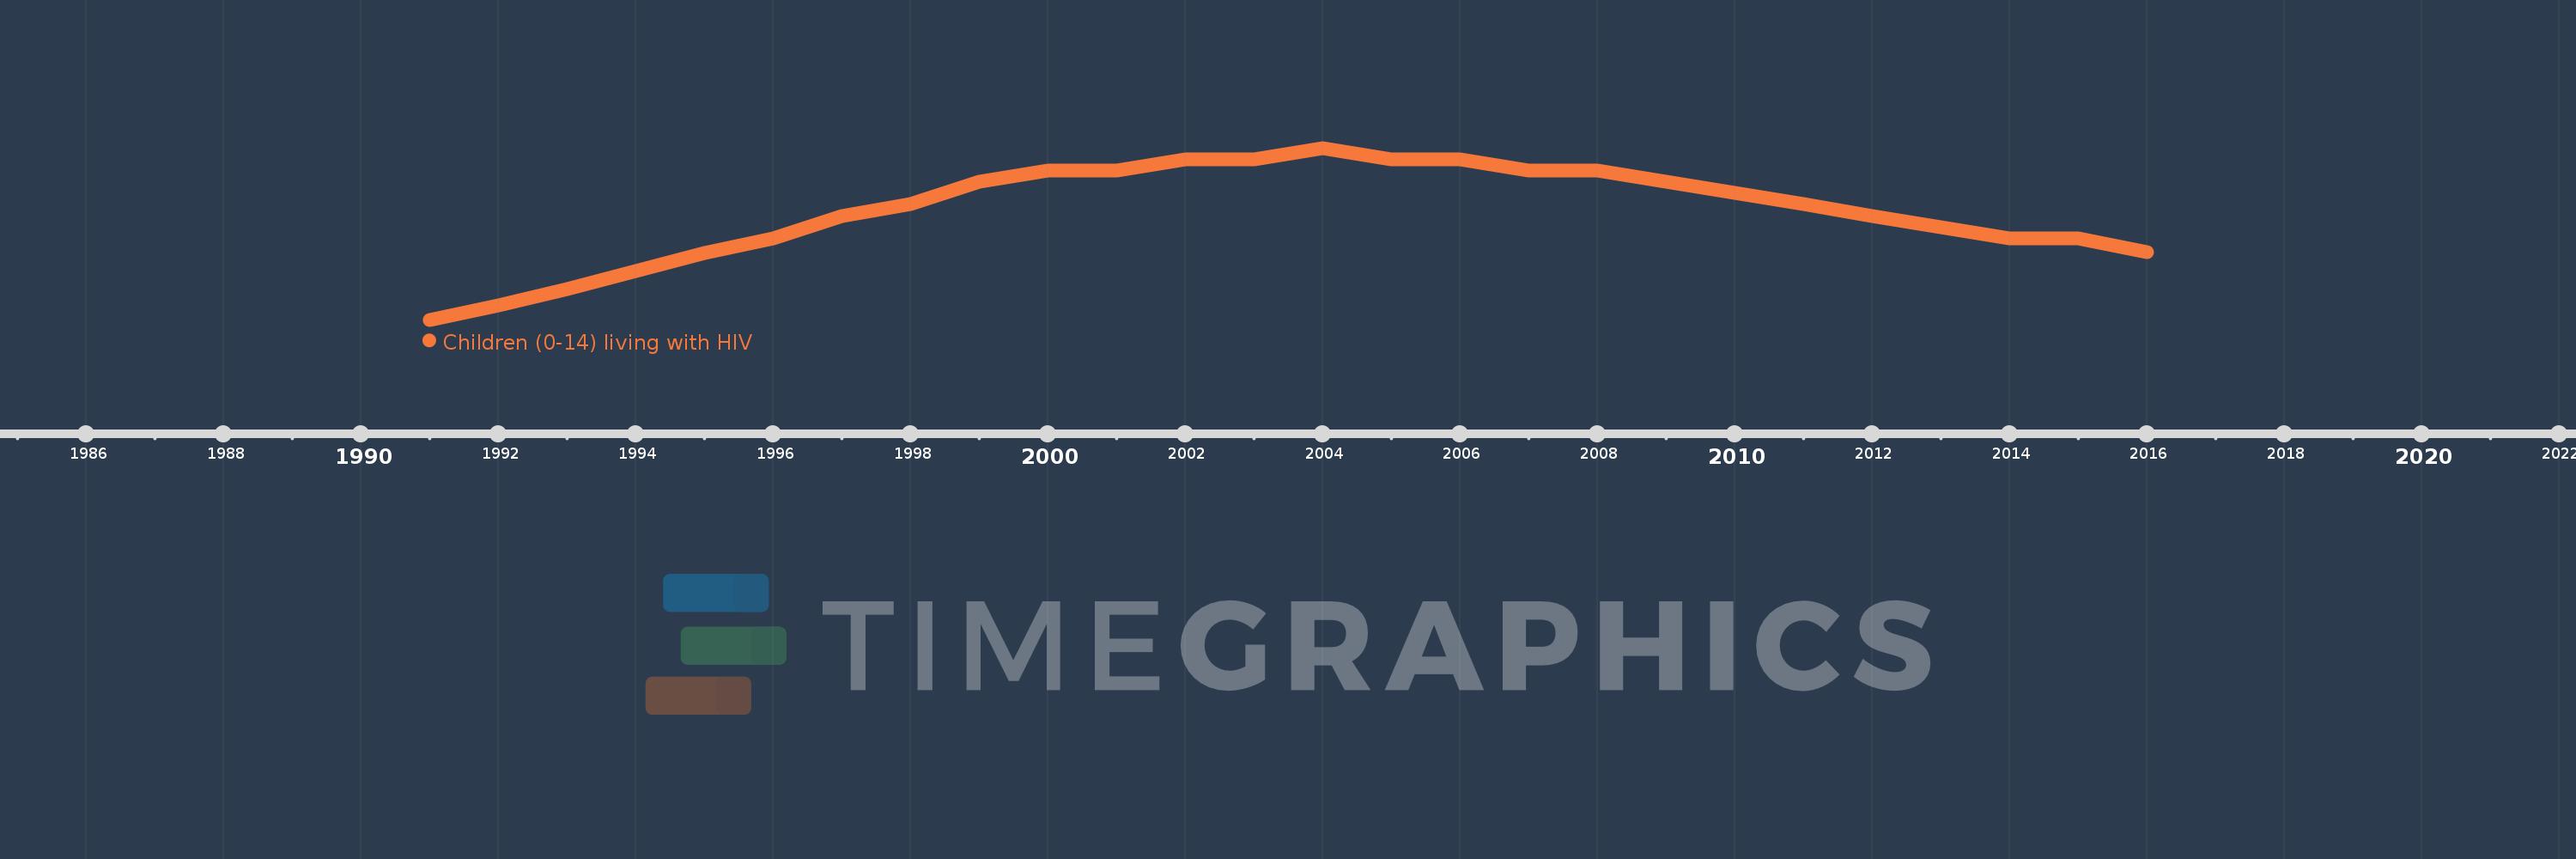
Children (0-14) living with HIV
2016,2015,2014,2013,2012,2011,2010,2009,2008,2007,2006,2005,2004,2003,2002,2001,2000,1999,1998,1997,1996,1995,1994,1993,1992,1991
Public Timelines
FAQ
Menu
Public Timelines
FAQ
For education
For educational institutions
For teachers
For students
Open cabinet
Create
Close
Create a timeline
Public timelines
Library
FAQ
Download
Global statistics library
→
Kenya
→
Children (0-14) living with HIV
This statistics in other country:
Afghanistan
Algeria
Angola
Argentina
Australia
Azerbaijan
Bahamas, The
Bangladesh
Belarus
Belize
Benin
Bolivia
Botswana
Brazil
Burkina Faso
Burundi
Cabo Verde
Cameroon
Central African Republic
Chad
Colombia
Congo, Dem. Rep.
Costa Rica
Cote d'Ivoire
Cuba
Djibouti
Dominican Republic
Ecuador
Egypt, Arab Rep.
El Salvador
Equatorial Guinea
Eritrea
Gabon
Gambia, The
Georgia
Ghana
Greece
Guatemala
Guinea
Guyana
Haiti
Honduras
Indonesia
Iran, Islamic Rep.
Italy
Jamaica
Kazakhstan
Kenya
Kyrgyz Republic
Latvia
Lesotho
Liberia
Madagascar
Malawi
Malaysia
Mali
Mauritania
Mexico
Moldova
Mongolia
Morocco
Mozambique
Myanmar
Namibia
Nepal
Nicaragua
Niger
Nigeria
Pakistan
Panama
Papua New Guinea
Paraguay
Peru
Philippines
Rwanda
Senegal
Sierra Leone
Somalia
South Africa
South Sudan
Spain
Sri Lanka
Sudan
Suriname
Swaziland
Tajikistan
Tanzania
Thailand
Togo
Trinidad and Tobago
Uganda
Ukraine
Uruguay
Uzbekistan
Venezuela, RB
Vietnam
World
Yemen, Rep.
Zambia
Zimbabwe
Timeline:
This timeline shows a graph from
1991
to
2016
of Kenya. No data until
1990
. Number of actual observations by date:
26
.
Source name:
World Development Indicators
Source organization:
UNAIDS estimates.
Categories, topics:
Health
Last updated:
apr 23, 2017
Indicators value changes by year
Meaning:
133.846K
Minimum:
38.0K
jan 1, 1991
Maximum:
190.0K
jan 1, 2004
At the date of observation
Value
Absolute change
Change from the previous value
jan 1, 1991
38.0K
+38.0K
0.0%
jan 1, 1992
51.0K
+13.0K
34.21%
jan 1, 1993
65.0K
+14.0K
27.45%
jan 1, 1994
81.0K
+16.0K
24.62%
jan 1, 1995
97.0K
+16.0K
19.75%
jan 1, 1996
110.0K
+13.0K
13.4%
jan 1, 1997
130.0K
+20.0K
18.18%
jan 1, 1998
140.0K
+10.0K
7.69%
jan 1, 1999
160.0K
+20.0K
14.29%
jan 1, 2000
170.0K
+10.0K
6.25%
jan 1, 2001
170.0K
0.0
0.0%
jan 1, 2002
180.0K
+10.0K
5.88%
jan 1, 2003
180.0K
0.0
0.0%
jan 1, 2004
190.0K
+10.0K
5.56%
jan 1, 2005
180.0K
-10.0K
-5.26%
jan 1, 2006
180.0K
0.0
0.0%
jan 1, 2007
170.0K
-10.0K
-5.56%
jan 1, 2008
170.0K
0.0
0.0%
jan 1, 2009
160.0K
-10.0K
-5.88%
jan 1, 2010
150.0K
-10.0K
-6.25%
jan 1, 2011
140.0K
-10.0K
-6.67%
jan 1, 2012
130.0K
-10.0K
-7.14%
jan 1, 2013
120.0K
-10.0K
-7.69%
jan 1, 2014
110.0K
-10.0K
-8.33%
jan 1, 2015
110.0K
0.0
0.0%
jan 1, 2016
98.0K
-12.0K
-10.91%
Ranking of countries by current statistics by years
About & Feedback
Terms
Privacy
Library
2024
©
Time.Graphics
Support 24/7
Cabinet
Get premium
Donate
The service accepts bank transfer (ACH, Wire) or cards (Visa, MasterCard, etc). Processed by Stripe.
Secured with SSL
Excellent (Trustpilot Reviews)
Based on 115+ reviews
Write your own review on
Trustpilot.com
