29
/
en
AIzaSyAYiBZKx7MnpbEhh9jyipgxe19OcubqV5w
April 1, 2024
166530
Kazakhstan
KAZ
true
2
1
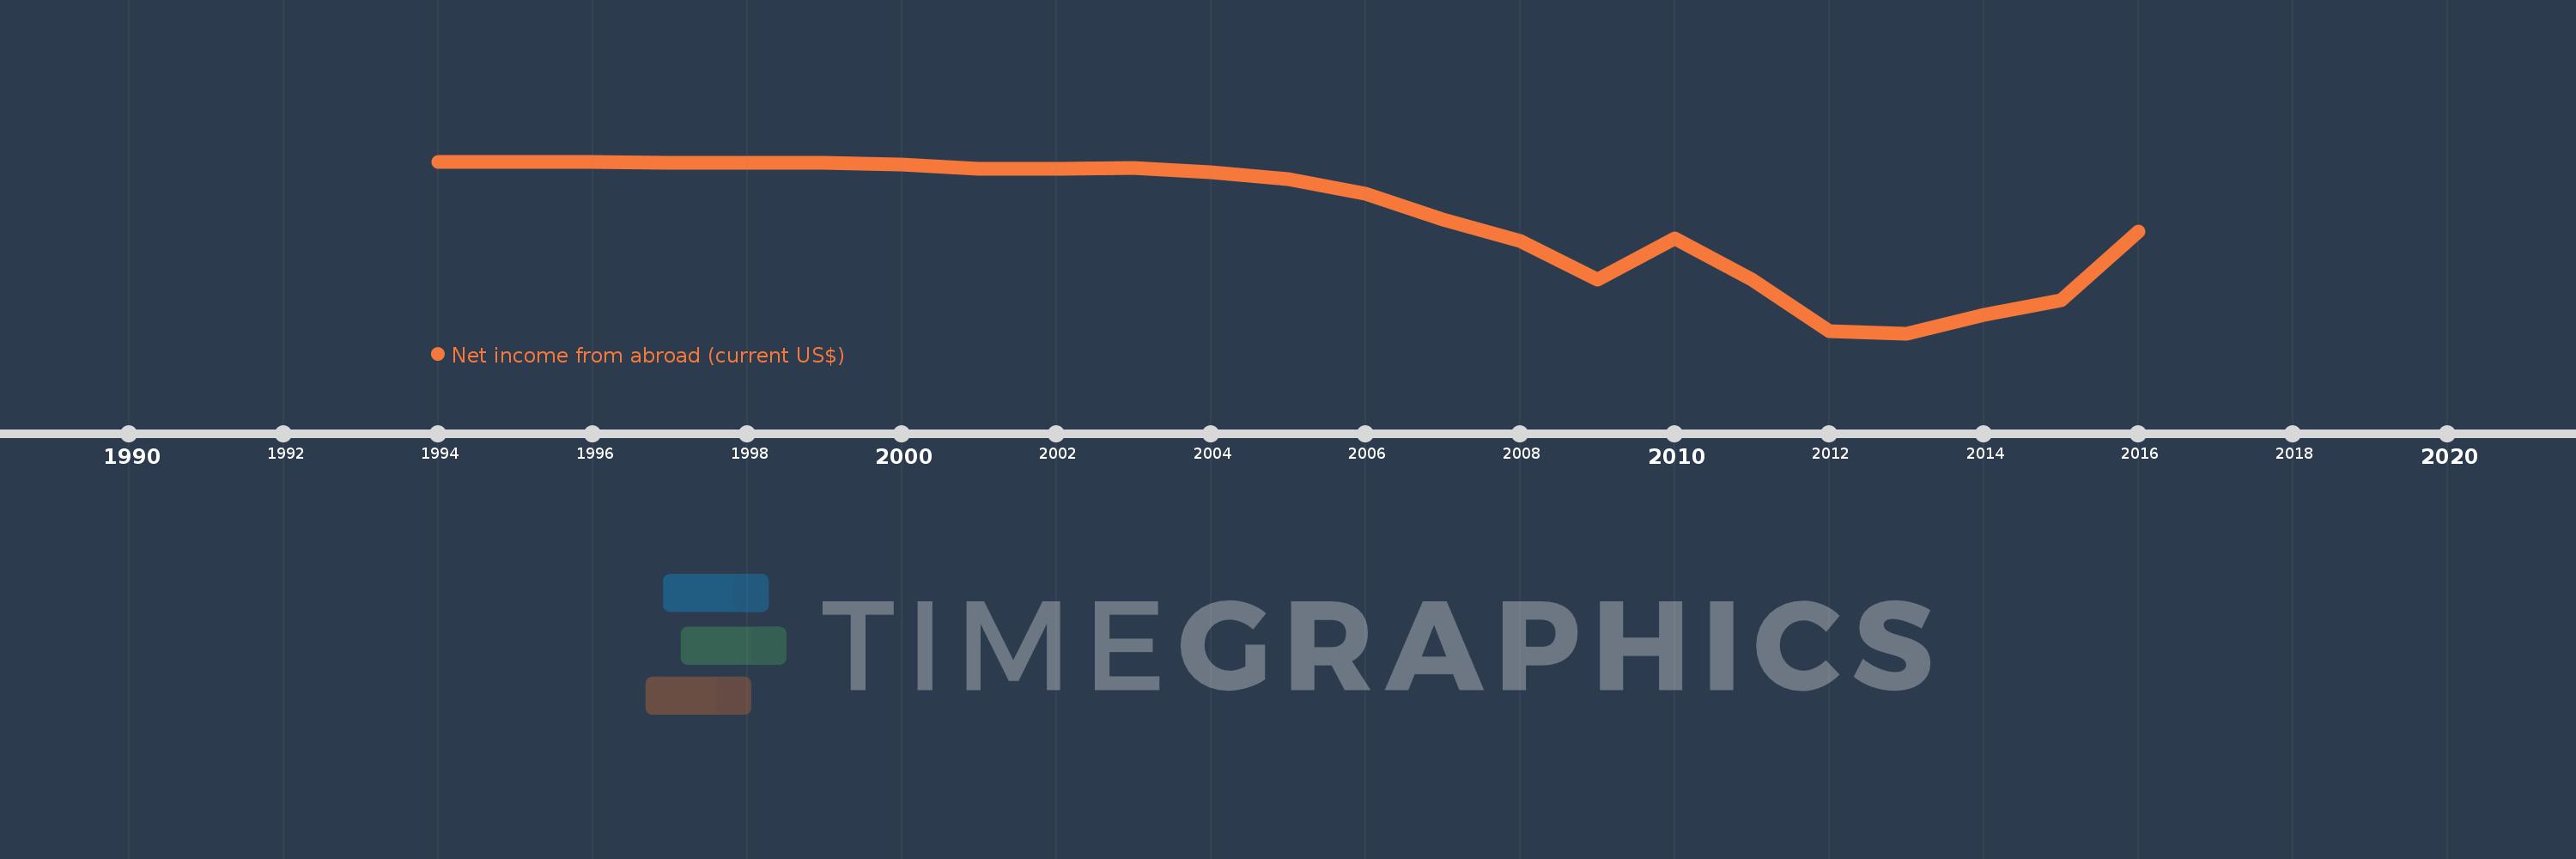
Net income from abroad (current US$)
2016,2015,2014,2013,2012,2011,2010,2009,2008,2007,2006,2005,2004,2003,2002,2001,2000,1999,1998,1997,1996,1995,1994
This statistics in other country:
AfghanistanAlbaniaAlgeriaAndorraAngolaAntigua and BarbudaArgentinaArmeniaAustraliaAustriaAzerbaijanBahamas, TheBahrainBangladeshBarbadosBelarusBelgiumBelizeBeninBermudaBhutanBoliviaBosnia and HerzegovinaBotswanaBrazilBrunei DarussalamBulgariaBurkina FasoBurundiCabo VerdeCambodiaCameroonCanadaCentral African RepublicChadChannel IslandsChileChinaColombiaComorosCongo, Dem. Rep.Congo, Rep.Costa RicaCote d'IvoireCroatiaCubaCyprusCzech RepublicDenmarkDjiboutiDominicaDominican RepublicEcuadorEgypt, Arab Rep.El SalvadorEquatorial GuineaEritreaEstoniaEthiopiaFaroe IslandsFijiFinlandFranceFrench PolynesiaGabonGambia, TheGeorgiaGermanyGhanaGreeceGreenlandGrenadaGuatemalaGuineaGuinea-BissauGuyanaHaitiHondurasHong Kong SAR, ChinaHungaryIcelandIndiaIndonesiaIran, Islamic Rep.IraqIrelandIsraelItalyJamaicaJapanJordanKazakhstanKenyaKiribatiKorea, Rep.KosovoKuwaitKyrgyz RepublicLao PDRLatviaLebanonLesothoLiberiaLibyaLithuaniaLuxembourgMacao SAR, ChinaMacedonia, FYRMadagascarMalawiMalaysiaMaldivesMaliMaltaMarshall IslandsMauritaniaMauritiusMexicoMicronesia, Fed. Sts.MoldovaMonacoMongoliaMontenegroMoroccoMozambiqueMyanmarNamibiaNepalNetherlandsNew CaledoniaNew ZealandNicaraguaNigerNigeriaNorwayOmanPakistanPalauPanamaPapua New GuineaParaguayPeruPhilippinesPolandPortugalPuerto RicoQatarRomaniaRussian FederationRwandaSamoaSao Tome and PrincipeSaudi ArabiaSenegalSerbiaSeychellesSierra LeoneSingaporeSlovak RepublicSloveniaSolomon IslandsSomaliaSouth AfricaSouth SudanSpainSri LankaSt. Kitts and NevisSt. LuciaSt. Vincent and the GrenadinesSudanSurinameSwazilandSwedenSwitzerlandSyrian Arab RepublicTajikistanTanzaniaThailandTimor-LesteTogoTongaTrinidad and TobagoTunisiaTurkeyTurkmenistanTuvaluUgandaUkraineUnited Arab EmiratesUnited KingdomUnited StatesUruguayUzbekistanVanuatuVenezuela, RBVietnamVirgin Islands (U.S.)West Bank and GazaYemen, Rep.ZambiaZimbabwe Timeline:
This timeline shows a graph from 1994 to 2016 of Kazakhstan. No data until 1993. Number of actual observations by date: 23.
Source name:
World Development Indicators
Source organization:
World Bank national accounts data, and OECD National Accounts data files.
Categories, topics:
Economy & Growth
Last updated:
apr 23, 2017
Indicators value changes by year
Minimum:
-28.104 bln
jan 1, 2013
Maximum:
-45.2 mln
jan 1, 1994
At the date of observation
Value
Absolute change
Change from previous value
jan 1, 1994
-45.2 mln
-45.2 mln
0.0%
jan 1, 1995
-96.6 mln
-51.4 mln
113.72%
jan 1, 1996
-145.5 mln
-48.9 mln
50.62%
jan 1, 1997
-220.1 mln
-74.6 mln
51.27%
jan 1, 1998
-314.9 mln
-94.8 mln
43.07%
jan 1, 1999
-306.6 mln
+8.3 mln
-2.64%
jan 1, 2000
-568.8 mln
-262.2 mln
85.52%
jan 1, 2001
-1.254 bln
-685.254 mln
120.47%
jan 1, 2002
-1.237 bln
+17.093 mln
-1.36%
jan 1, 2003
-1.127 bln
+109.594 mln
-8.86%
jan 1, 2004
-1.747 bln
-619.19 mln
54.92%
jan 1, 2005
-2.863 bln
-1.117 bln
63.93%
jan 1, 2006
-5.366 bln
-2.503 bln
87.43%
jan 1, 2007
-9.453 bln
-4.087 bln
76.15%
jan 1, 2008
-12.957 bln
-3.504 bln
37.06%
jan 1, 2009
-19.326 bln
-6.37 bln
49.16%
jan 1, 2010
-12.621 bln
+6.706 bln
-34.7%
jan 1, 2011
-19.371 bln
-6.75 bln
53.49%
jan 1, 2012
-27.724 bln
-8.353 bln
43.12%
jan 1, 2013
-28.104 bln
-380.201 mln
1.37%
jan 1, 2014
-25.149 bln
+2.955 bln
-10.52%
jan 1, 2015
-22.639 bln
+2.51 bln
-9.98%
jan 1, 2016
-11.515 bln
+11.123 bln
-49.13%
Ranking of countries by current statistics by years


Comments: