29
/
en
AIzaSyAYiBZKx7MnpbEhh9jyipgxe19OcubqV5w
April 1, 2024
160948
Israel
ISR
true
2
1
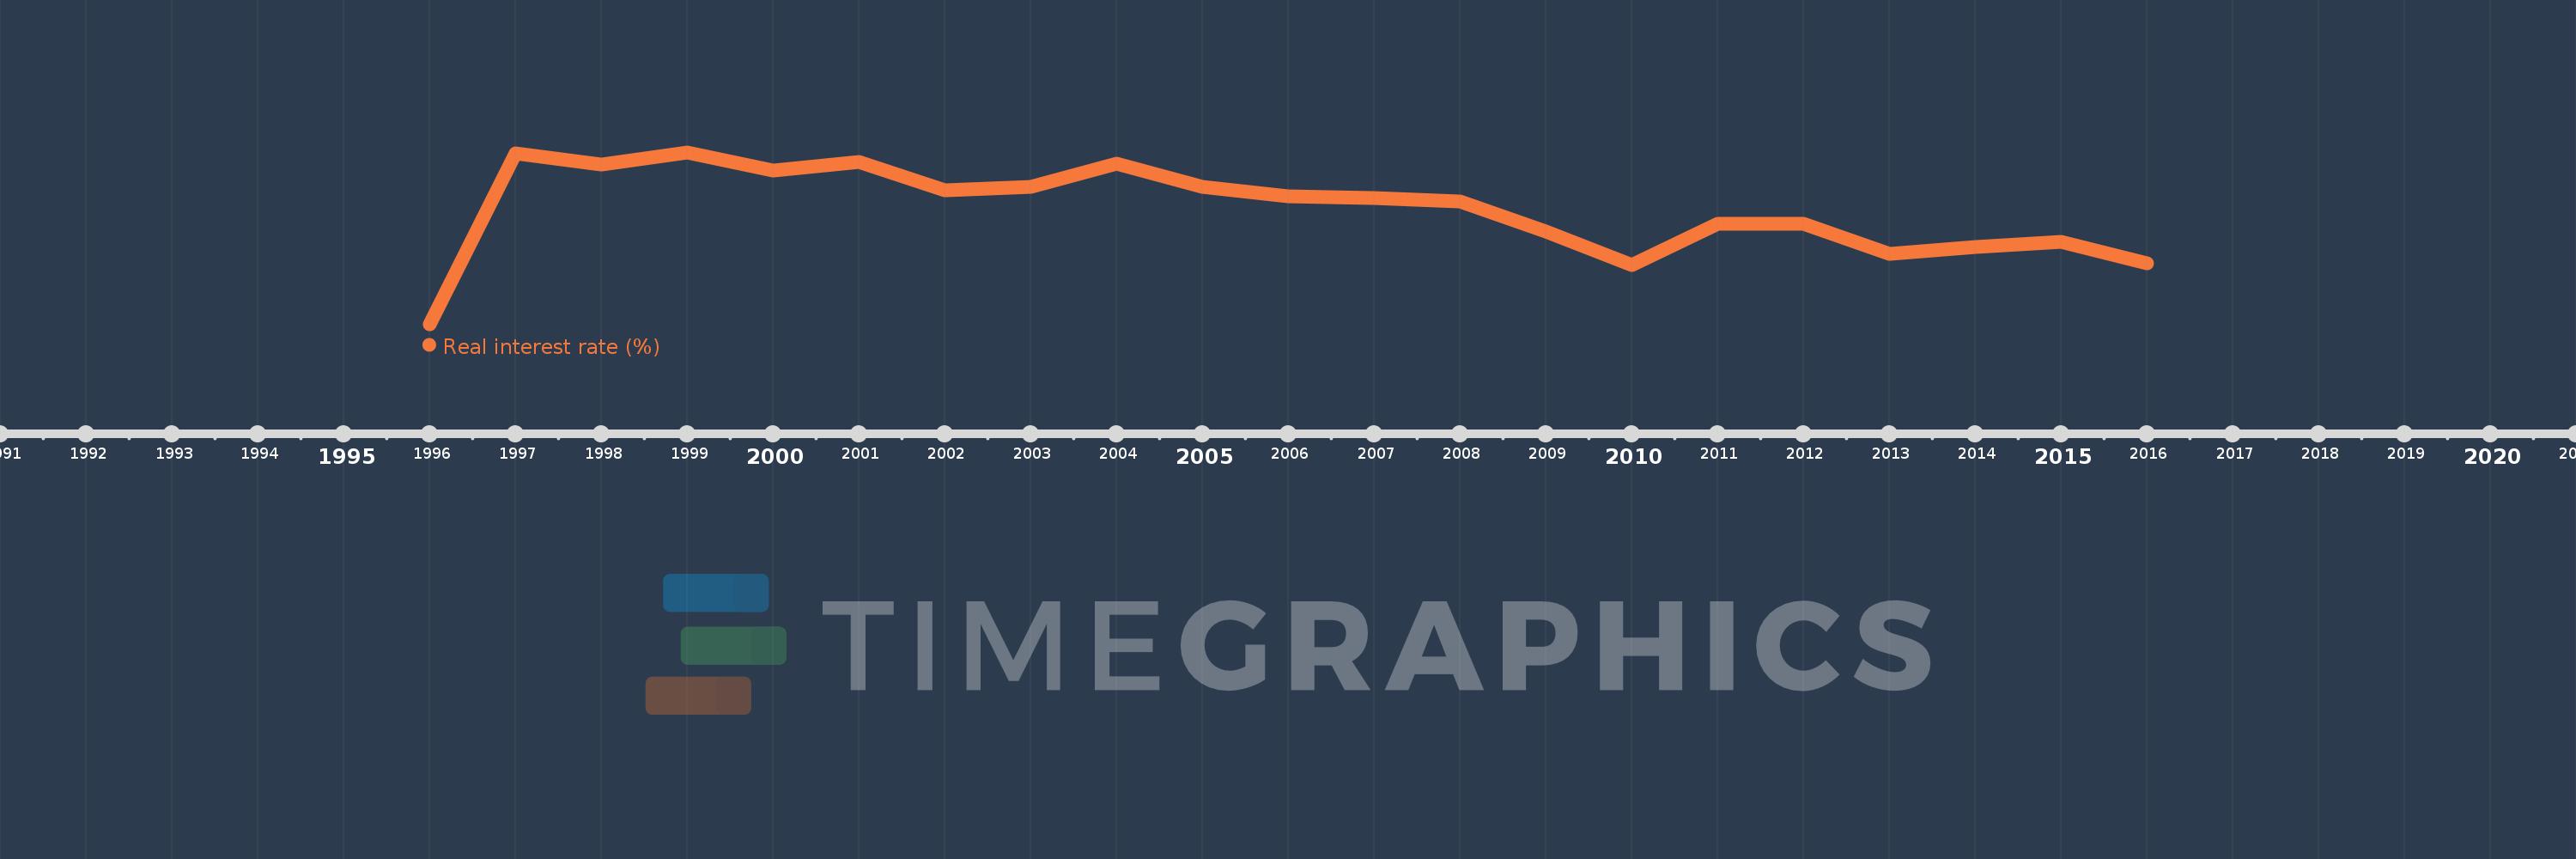
Real interest rate (%)
2016,2015,2014,2013,2012,2011,2010,2009,2008,2007,2006,2005,2004,2003,2002,2001,2000,1999,1998,1997,1996
This statistics in other country:
AfghanistanAlbaniaAlgeriaAngolaAntigua and BarbudaArgentinaArmeniaArubaAustraliaAustriaAzerbaijanBahamas, TheBahrainBangladeshBarbadosBelarusBelgiumBelizeBeninBhutanBoliviaBosnia and HerzegovinaBotswanaBrazilBrunei DarussalamBulgariaBurkina FasoBurundiCabo VerdeCameroonCanadaCentral African RepublicChadChileChinaColombiaComorosCongo, Dem. Rep.Congo, Rep.Costa RicaCote d'IvoireCroatiaCyprusCzech RepublicDenmarkDjiboutiDominicaDominican RepublicEcuadorEgypt, Arab Rep.Equatorial GuineaEstoniaEthiopiaFijiFinlandFranceGabonGambia, TheGeorgiaGermanyGhanaGreeceGrenadaGuatemalaGuineaGuinea-BissauGuyanaHaitiHondurasHong Kong SAR, ChinaHungaryIcelandIndiaIndonesiaIran, Islamic Rep.IraqIrelandIsraelItalyJamaicaJapanJordanKenyaKorea, Rep.KosovoKuwaitKyrgyz RepublicLao PDRLatviaLebanonLesothoLiberiaLibyaLithuaniaLuxembourgMacao SAR, ChinaMacedonia, FYRMadagascarMalawiMalaysiaMaldivesMaliMaltaMauritaniaMauritiusMexicoMicronesia, Fed. Sts.MoldovaMongoliaMontenegroMoroccoMozambiqueMyanmarNamibiaNepalNetherlandsNew ZealandNicaraguaNigerNigeriaNorwayOmanPanamaPapua New GuineaParaguayPeruPhilippinesPolandPortugalQatarRomaniaRussian FederationRwandaSamoaSan MarinoSao Tome and PrincipeSenegalSerbiaSeychellesSierra LeoneSingaporeSlovak RepublicSloveniaSolomon IslandsSouth AfricaSouth SudanSpainSri LankaSt. Kitts and NevisSt. LuciaSt. Vincent and the GrenadinesSurinameSwazilandSwedenSwitzerlandSyrian Arab RepublicTajikistanTanzaniaThailandTimor-LesteTogoTongaTrinidad and TobagoTunisiaUgandaUkraineUnited KingdomUnited StatesUruguayVanuatuVenezuela, RBVietnamWest Bank and GazaYemen, Rep.ZambiaZimbabwe Timeline:
This timeline shows a graph from 1996 to 2016 of Israel. No data until 1995. Number of actual observations by date: 21.
Source name:
World Development Indicators
Source organization:
International Monetary Fund, International Financial Statistics and data files using World Bank data on the GDP deflator.
Categories, topics:
Financial Sector
Last updated:
apr 23, 2017
Indicators value changes by year
Minimum:
-4.502
jan 1, 1996
Maximum:
10.018
jan 1, 1999
At the date of observation
Value
Absolute change
Change from previous value
jan 1, 1996
-4.502
-4.502
0.0%
jan 1, 1997
9.94
+14.442
-320.8%
jan 1, 1998
8.979
-0.961
-9.67%
jan 1, 1999
10.018
+1.039
11.57%
jan 1, 2000
8.501
-1.517
-15.15%
jan 1, 2001
9.184
+0.683
8.04%
jan 1, 2002
6.836
-2.348
-25.57%
jan 1, 2003
7.118
+0.282
4.13%
jan 1, 2004
9.069
+1.951
27.41%
jan 1, 2005
7.076
-1.993
-21.97%
jan 1, 2006
6.305
-0.771
-10.9%
jan 1, 2007
6.156
-0.149
-2.37%
jan 1, 2008
5.905
-0.25
-4.06%
jan 1, 2009
3.365
-2.541
-43.02%
jan 1, 2010
0.474
-2.891
-85.91%
jan 1, 2011
3.965
+3.491
736.49%
jan 1, 2012
3.999
+0.035
0.87%
jan 1, 2013
1.421
-2.579
-64.48%
jan 1, 2014
2.012
+0.592
41.64%
jan 1, 2015
2.448
+0.436
21.65%
jan 1, 2016
0.665
-1.783
-72.85%
Ranking of countries by current statistics by years


Comments: