29
/
en
AIzaSyAYiBZKx7MnpbEhh9jyipgxe19OcubqV5w
April 1, 2024
149986
Honduras
HND
true
2
1
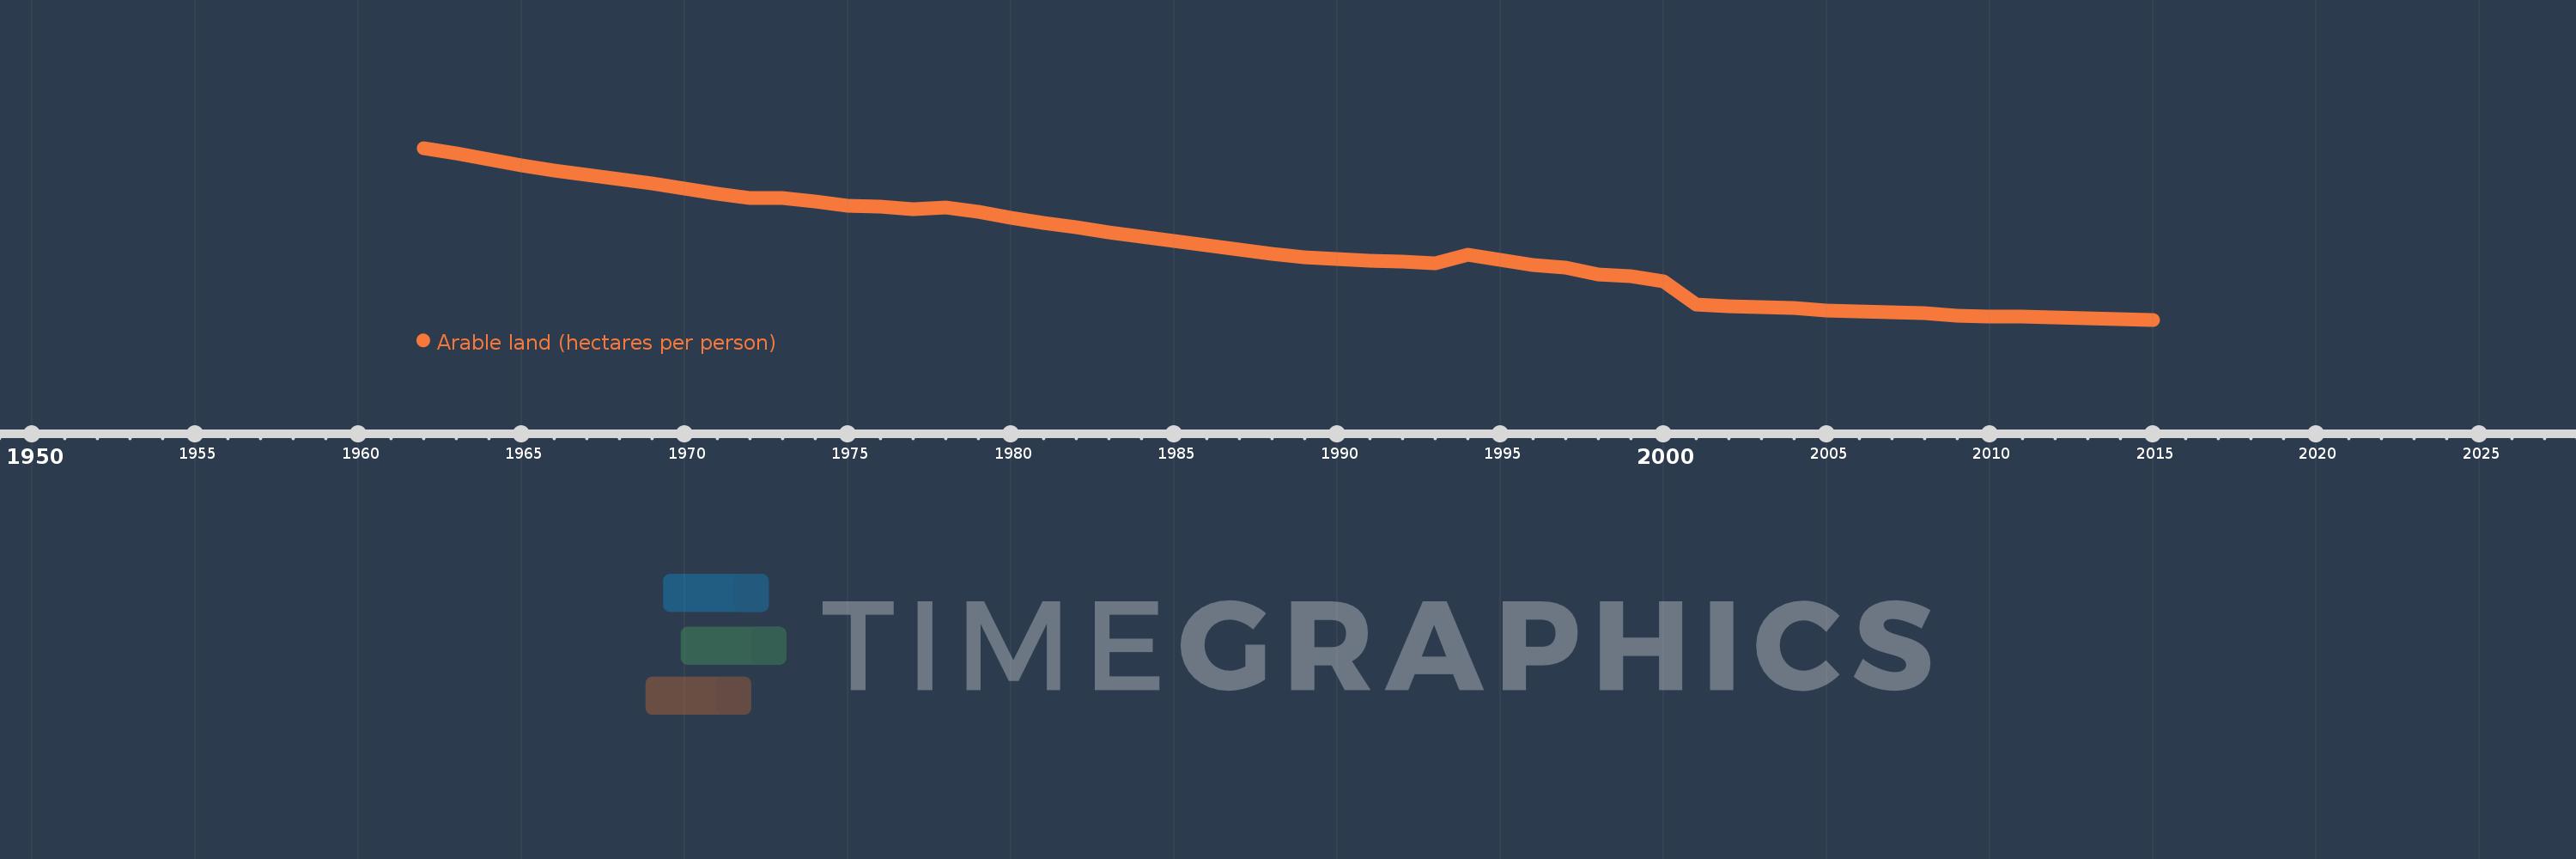
Arable land (hectares per person)
2015,2014,2013,2012,2011,2010,2009,2008,2007,2006,2005,2004,2003,2002,2001,2000,1999,1998,1997,1996,1995,1994,1993,1992,1991,1990,1989,1988,1987,1986,1985,1984,1983,1982,1981,1980,1979,1978,1977,1976,1975,1974,1973,1972,1971,1970,1969,1968,1967,1966,1965,1964,1963,1962
This statistics in other country:
AfghanistanAlbaniaAlgeriaAmerican SamoaAndorraAngolaAntigua and BarbudaArab WorldArgentinaArmeniaArubaAustraliaAustriaAzerbaijanBahamas, TheBahrainBangladeshBarbadosBelarusBelgiumBelizeBeninBermudaBhutanBoliviaBosnia and HerzegovinaBotswanaBrazilBritish Virgin IslandsBrunei DarussalamBulgariaBurkina FasoBurundiCabo VerdeCambodiaCameroonCanadaCaribbean small statesCayman IslandsCentral African RepublicCentral Europe and the BalticsChadChannel IslandsChileChinaColombiaComorosCongo, Dem. Rep.Congo, Rep.Costa RicaCote d'IvoireCroatiaCubaCyprusCzech RepublicDenmarkDjiboutiDominicaDominican RepublicEarly-demographic dividendEast Asia & PacificEast Asia & Pacific (excluding high income)East Asia & Pacific (IDA & IBRD countries)EcuadorEgypt, Arab Rep.El SalvadorEquatorial GuineaEritreaEstoniaEthiopiaEuro areaEurope & Central AsiaEurope & Central Asia (excluding high income)Europe & Central Asia (IDA & IBRD countries)European UnionFaroe IslandsFijiFinlandFragile and conflict affected situationsFranceFrench PolynesiaGabonGambia, TheGeorgiaGermanyGhanaGreeceGreenlandGrenadaGuamGuatemalaGuineaGuinea-BissauGuyanaHaitiHeavily indebted poor countries (HIPC)High incomeHondurasHong Kong SAR, ChinaHungaryIBRD onlyIcelandIDA & IBRD totalIDA blendIDA onlyIDA totalIndiaIndonesiaIran, Islamic Rep.IraqIrelandIsle of ManIsraelItalyJamaicaJapanJordanKazakhstanKenyaKiribatiKorea, Dem. People’s Rep.Korea, Rep.KosovoKuwaitKyrgyz RepublicLao PDRLate-demographic dividendLatin America & Caribbean Latin America & Caribbean (excluding high income)Latin America & the Caribbean (IDA & IBRD countries)LatviaLeast developed countries: UN classificationLebanonLesothoLiberiaLibyaLiechtensteinLithuaniaLow & middle incomeLow incomeLower middle incomeLuxembourgMacedonia, FYRMadagascarMalawiMalaysiaMaldivesMaliMaltaMarshall IslandsMauritaniaMauritiusMexicoMicronesia, Fed. Sts.Middle East & North AfricaMiddle East & North Africa (excluding high income)Middle East & North Africa (IDA & IBRD countries)Middle incomeMoldovaMongoliaMontenegroMoroccoMozambiqueMyanmarNamibiaNepalNetherlandsNew CaledoniaNew ZealandNicaraguaNigerNigeriaNorth AmericaNorthern Mariana IslandsNorwayOECD membersOmanOther small statesPacific island small statesPakistanPalauPanamaPapua New GuineaParaguayPeruPhilippinesPolandPortugalPost-demographic dividendPre-demographic dividendPuerto RicoQatarRomaniaRussian FederationRwandaSamoaSan MarinoSao Tome and PrincipeSaudi ArabiaSenegalSerbiaSeychellesSierra LeoneSingaporeSlovak RepublicSloveniaSmall statesSolomon IslandsSomaliaSouth AfricaSouth AsiaSouth Asia (IDA & IBRD)SpainSri LankaSt. Kitts and NevisSt. LuciaSt. Vincent and the GrenadinesSub-Saharan Africa Sub-Saharan Africa (excluding high income)Sub-Saharan Africa (IDA & IBRD countries)SudanSurinameSwazilandSwedenSwitzerlandSyrian Arab RepublicTajikistanTanzaniaThailandTimor-LesteTogoTongaTrinidad and TobagoTunisiaTurkeyTurkmenistanTurks and Caicos IslandsUgandaUkraineUnited Arab EmiratesUnited KingdomUnited StatesUpper middle incomeUruguayUzbekistanVanuatuVenezuela, RBVietnamVirgin Islands (U.S.)West Bank and GazaWorldYemen, Rep.ZambiaZimbabwe Timeline:
This timeline shows a graph from 1962 to 2015 of Honduras. No data until 1961. Number of actual observations by date: 54.
Source name:
World Development Indicators
Source organization:
Food and Agriculture Organization, electronic files and web site.
Categories, topics:
Agriculture & Rural Development
Last updated:
apr 23, 2017
Indicators value changes by year
At the date of observation
Value
Absolute change
Change from previous value
jan 1, 1962
0.626
+0.626
0.0%
jan 1, 1963
0.61
-0.016
-2.53%
jan 1, 1964
0.592
-0.018
-2.88%
jan 1, 1965
0.575
-0.017
-2.92%
jan 1, 1966
0.56
-0.015
-2.6%
jan 1, 1967
0.547
-0.013
-2.35%
jan 1, 1968
0.535
-0.012
-2.22%
jan 1, 1969
0.522
-0.013
-2.44%
jan 1, 1970
0.507
-0.015
-2.88%
jan 1, 1971
0.494
-0.013
-2.5%
jan 1, 1972
0.482
-0.012
-2.5%
jan 1, 1973
0.481
-0.001
-0.22%
jan 1, 1974
0.471
-0.01
-2.12%
jan 1, 1975
0.459
-0.012
-2.48%
jan 1, 1976
0.455
-0.004
-0.93%
jan 1, 1977
0.449
-0.006
-1.32%
jan 1, 1978
0.454
+0.006
1.29%
jan 1, 1979
0.441
-0.014
-3.05%
jan 1, 1980
0.424
-0.017
-3.76%
jan 1, 1981
0.408
-0.016
-3.74%
jan 1, 1982
0.395
-0.013
-3.26%
jan 1, 1983
0.382
-0.013
-3.36%
jan 1, 1984
0.368
-0.014
-3.6%
jan 1, 1985
0.356
-0.012
-3.19%
jan 1, 1986
0.343
-0.013
-3.57%
jan 1, 1987
0.332
-0.011
-3.22%
jan 1, 1988
0.32
-0.012
-3.59%
jan 1, 1989
0.309
-0.011
-3.56%
jan 1, 1990
0.303
-0.006
-1.82%
jan 1, 1991
0.298
-0.005
-1.71%
jan 1, 1992
0.296
-0.002
-0.74%
jan 1, 1993
0.292
-0.003
-1.17%
jan 1, 1994
0.316
+0.024
8.2%
jan 1, 1995
0.302
-0.014
-4.43%
jan 1, 1996
0.286
-0.016
-5.38%
jan 1, 1997
0.279
-0.007
-2.33%
jan 1, 1998
0.26
-0.02
-7.13%
jan 1, 1999
0.254
-0.006
-2.17%
jan 1, 2000
0.24
-0.014
-5.46%
jan 1, 2001
0.171
-0.069
-28.75%
jan 1, 2002
0.168
-0.003
-2.01%
jan 1, 2003
0.164
-0.003
-1.96%
jan 1, 2004
0.161
-0.003
-1.92%
jan 1, 2005
0.155
-0.006
-3.53%
jan 1, 2006
0.153
-0.003
-1.84%
jan 1, 2007
0.15
-0.003
-1.81%
jan 1, 2008
0.147
-0.003
-1.78%
jan 1, 2009
0.14
-0.007
-4.73%
jan 1, 2010
0.138
-0.002
-1.48%
jan 1, 2011
0.136
-0.002
-1.61%
jan 1, 2012
0.134
-0.002
-1.54%
jan 1, 2013
0.132
-0.002
-1.48%
jan 1, 2014
0.13
-0.002
-1.44%
jan 1, 2015
0.128
-0.002
-1.41%
Ranking of countries by current statistics by years


Comments: