29
/
en
AIzaSyAYiBZKx7MnpbEhh9jyipgxe19OcubqV5w
April 1, 2024
147284
Guinea-Bissau
GNB
true
2
1
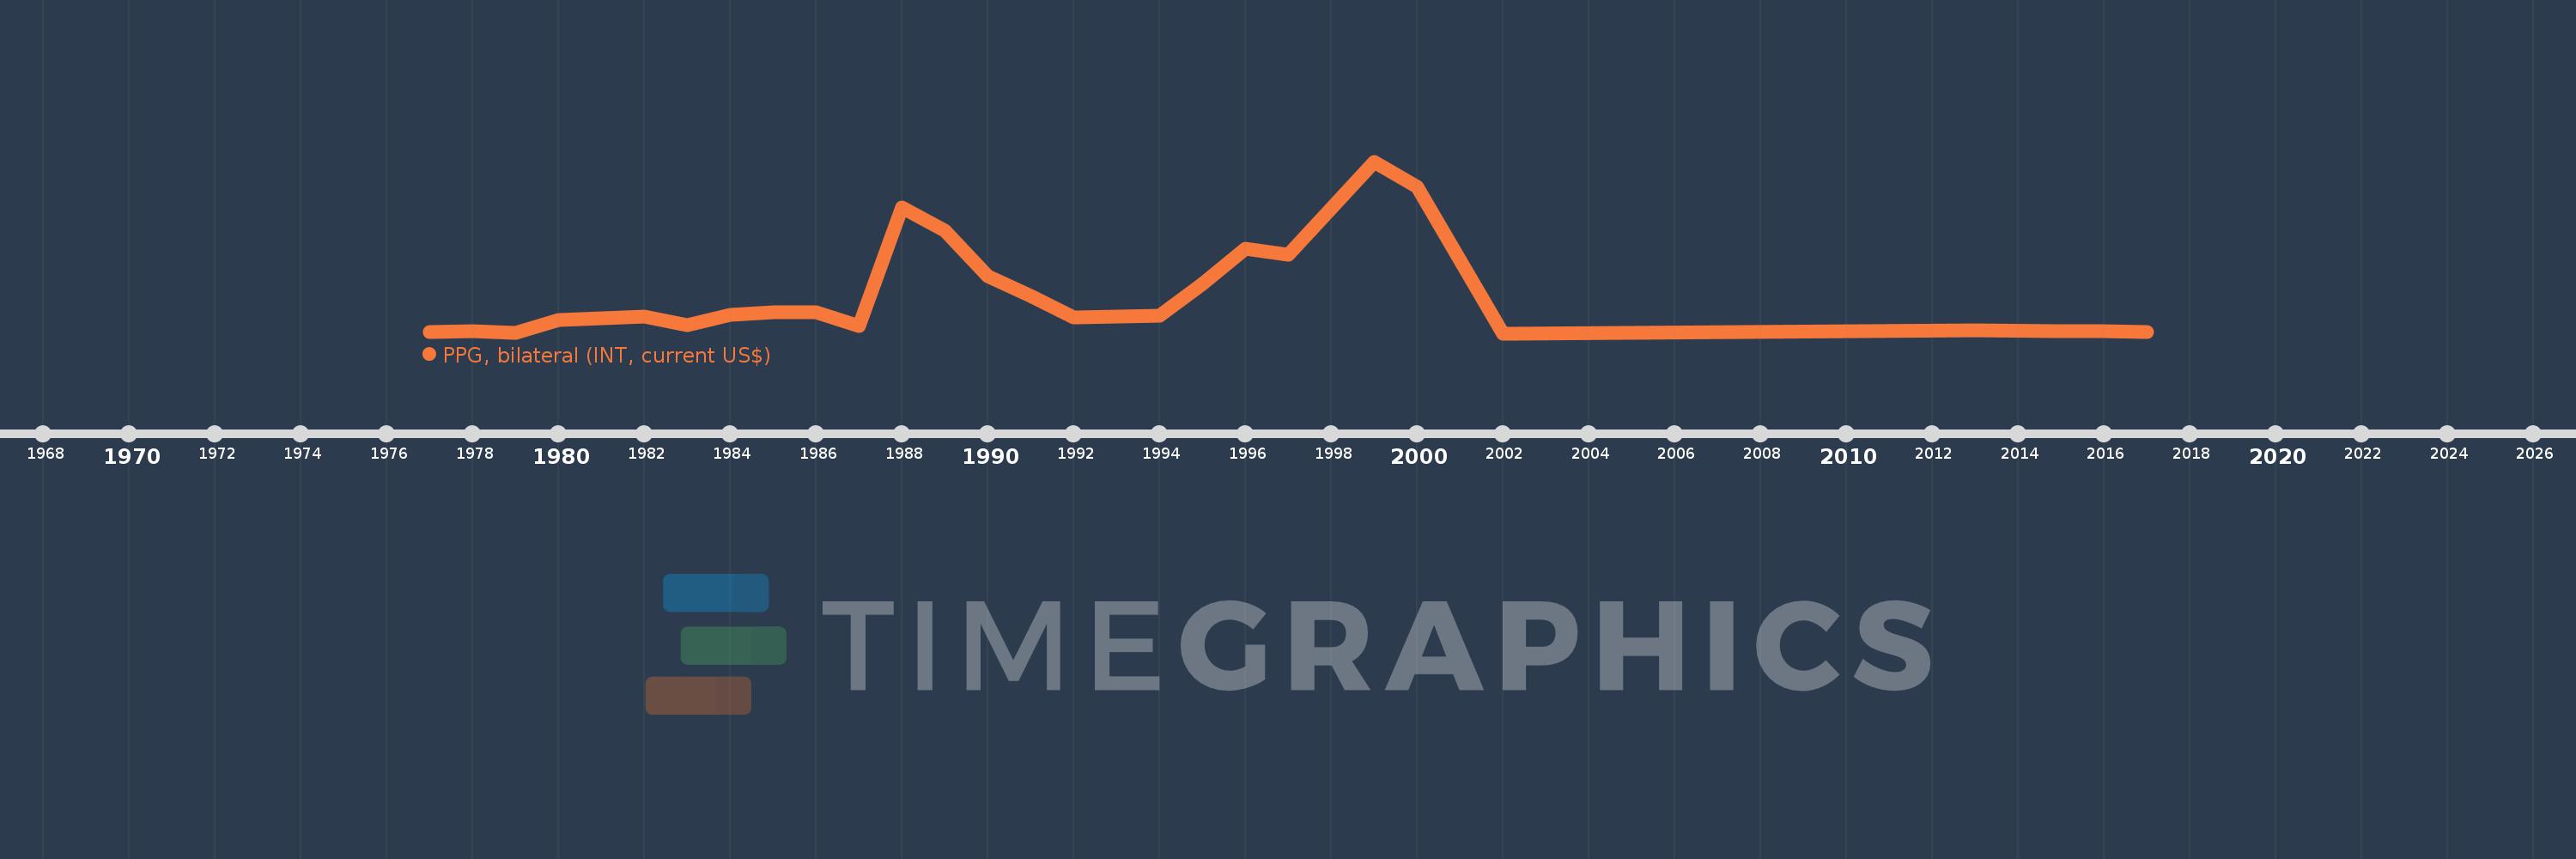
PPG, bilateral (INT, current US$)
2017,2016,2015,2013,2002,2000,1999,1997,1996,1995,1994,1993,1992,1991,1990,1989,1988,1987,1986,1985,1984,1983,1982,1981,1980,1979,1978,1977
This statistics in other country:
Timeline:
This timeline shows a graph from 1977 to 2017 of Guinea-Bissau. No data until 1976. Number of actual observations by date: 28.
Source name:
World Development Indicators
Source organization:
World Bank, International Debt Statistics.
Categories, topics:
External Debt
Last updated:
apr 23, 2017
Indicators value changes by year
Maximum:
2.506 mln
jan 1, 1999
At the date of observation
Value
Absolute change
Change from previous value
jan 1, 1977
20.0K
+20.0K
0.0%
jan 1, 1978
34.0K
+14.0K
70.0%
jan 1, 1979
11.0K
-23.0K
-67.65%
jan 1, 1980
197.0K
+186.0K
1.69K%
jan 1, 1981
223.0K
+26.0K
13.2%
jan 1, 1982
250.0K
+27.0K
12.11%
jan 1, 1983
127.0K
-123.0K
-49.2%
jan 1, 1984
278.0K
+151.0K
118.9%
jan 1, 1985
317.0K
+39.0K
14.03%
jan 1, 1986
308.0K
-9.0K
-2.84%
jan 1, 1987
110.0K
-198.0K
-64.29%
jan 1, 1988
1.843 mln
+1.733 mln
1.58K%
jan 1, 1989
1.504 mln
-339.0K
-18.39%
jan 1, 1990
834.0K
-670.0K
-44.55%
jan 1, 1991
551.0K
-283.0K
-33.93%
jan 1, 1992
233.0K
-318.0K
-57.71%
jan 1, 1993
248.0K
+15.0K
6.44%
jan 1, 1994
258.0K
+10.0K
4.03%
jan 1, 1995
720.0K
+462.0K
179.07%
jan 1, 1996
1.243 mln
+523.0K
72.64%
jan 1, 1997
1.147 mln
-96.0K
-7.72%
jan 1, 1999
2.506 mln
+1.359 mln
118.48%
jan 1, 2000
2.135 mln
-371.0K
-14.8%
jan 1, 2002
7.0K
-2.128 mln
-99.67%
jan 1, 2013
48.0K
+41.0K
585.71%
jan 1, 2015
34.0K
-14.0K
-29.17%
jan 1, 2016
32.0K
-2.0K
-5.88%
jan 1, 2017
29.0K
-3.0K
-9.38%
Ranking of countries by current statistics by years


Comments: