Download This statistics in other country:
Timeline:
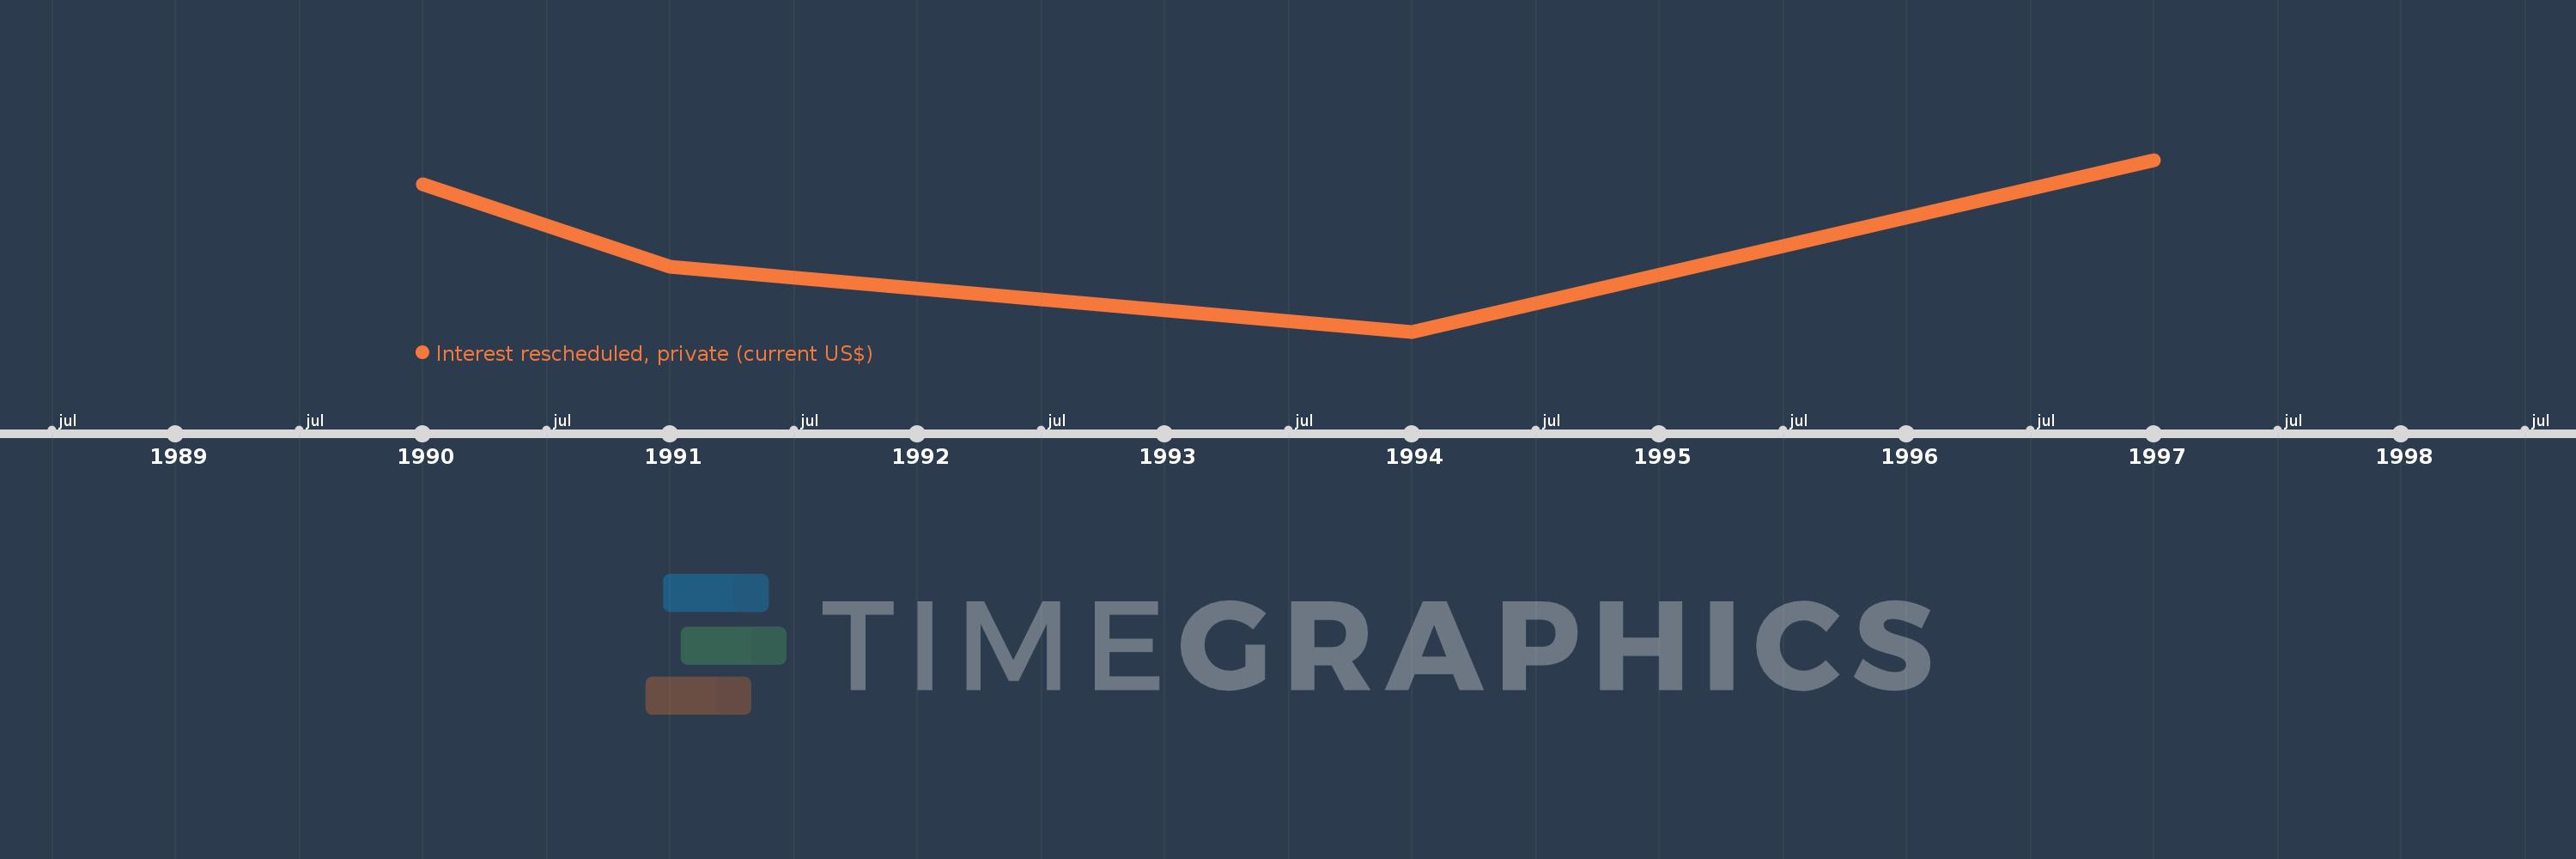
This timeline shows a graph from 1990 to 1997 of Guinea-Bissau. No data until 1989. Number of actual observations by date: 4.
Source name:
World Development Indicators
Source organization:
World Bank, International Debt Statistics.
Categories, topics:
External Debt
Last updated:
apr 23, 2017
Indicators value changes by year
Minimum:
1.5 mln
jan 1, 1994
Maximum:
5.621 mln
jan 1, 1997
At the date of observation
Value
Absolute change
Change from the previous value
jan 1, 1990
5.035 mln
+5.035 mln
0.0%
jan 1, 1991
3.064 mln
-1.971 mln
-39.15%
jan 1, 1994
1.5 mln
-1.564 mln
-51.04%
jan 1, 1997
5.621 mln
+4.121 mln
274.73%
Ranking of countries by current statistics by years
