29
/
en
AIzaSyAYiBZKx7MnpbEhh9jyipgxe19OcubqV5w
April 1, 2024
143425
Grenada
GRD
true
2
1
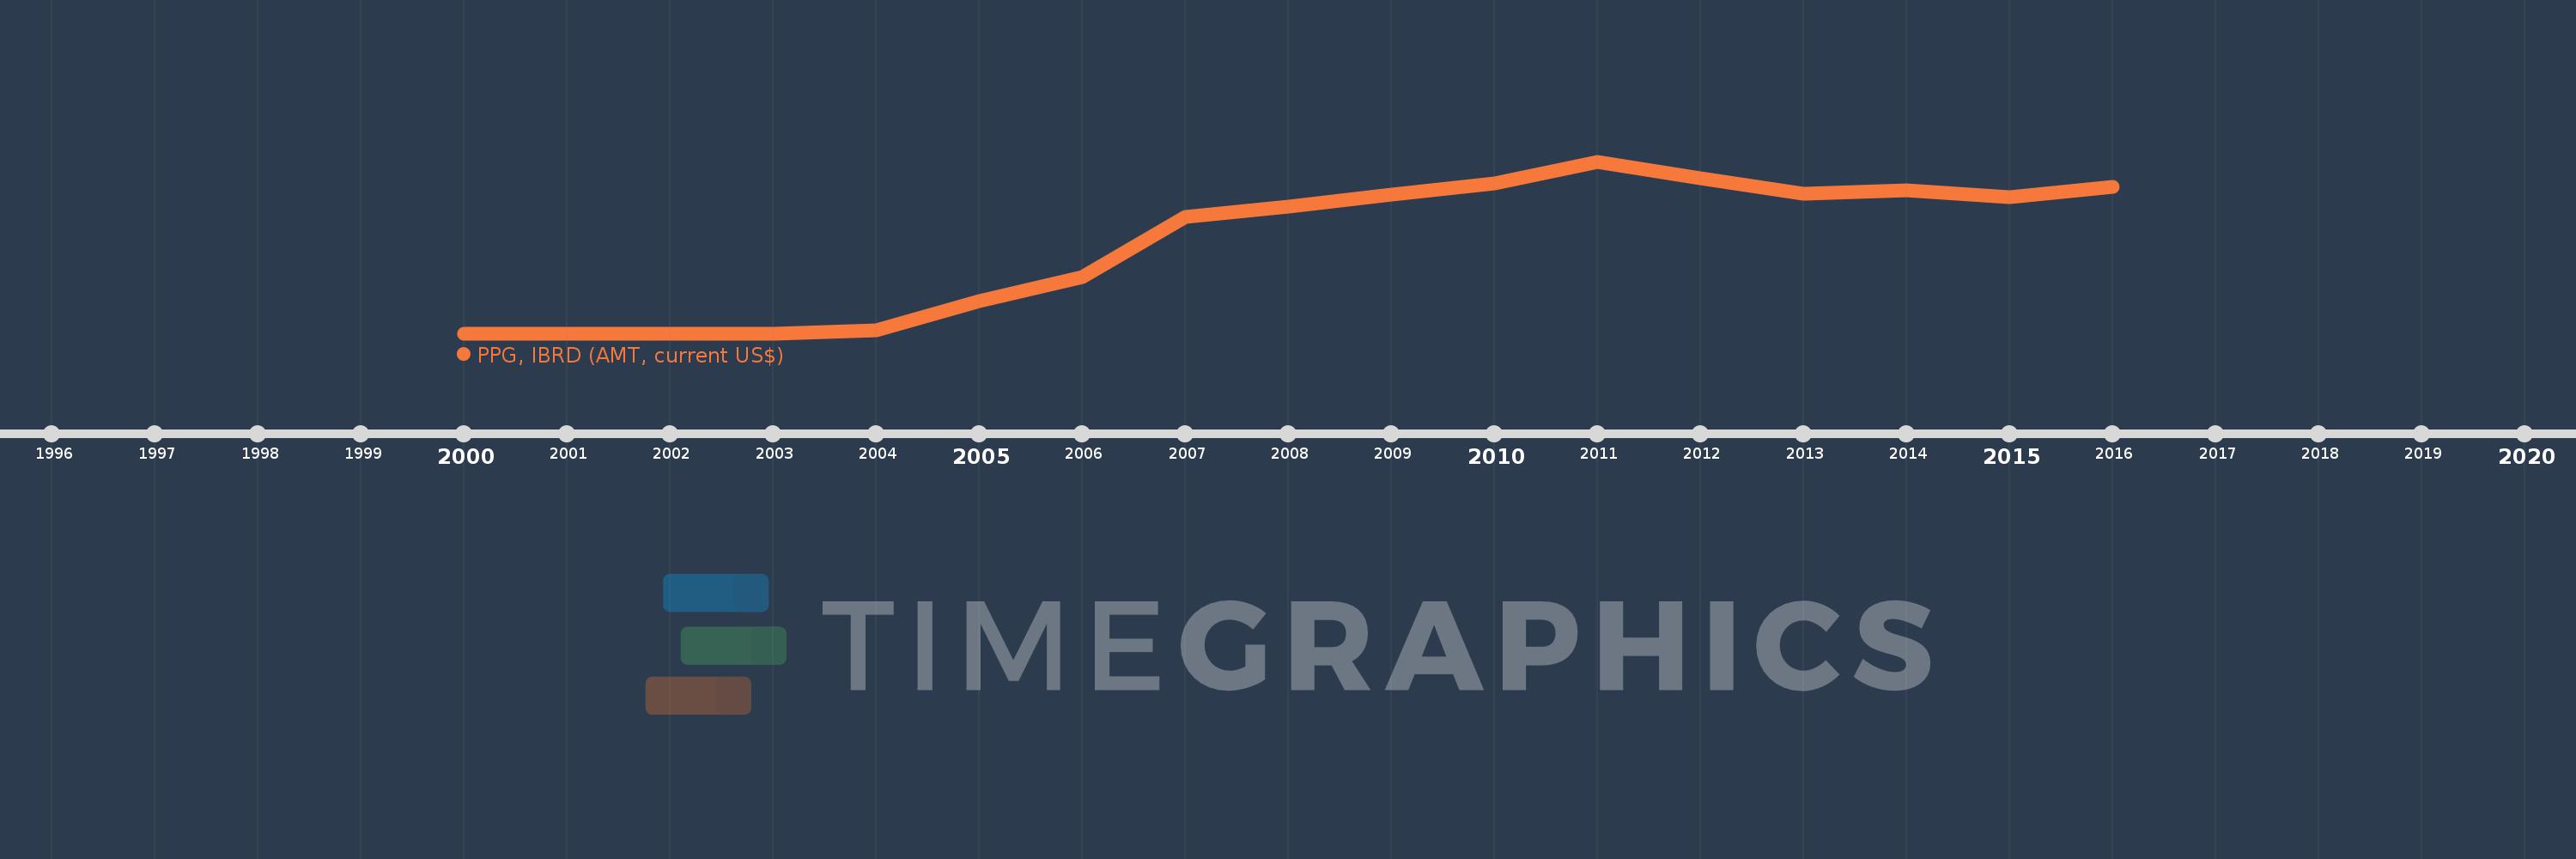
PPG, IBRD (AMT, current US$)
2016,2015,2014,2013,2012,2011,2010,2009,2008,2007,2006,2005,2004,2003,2002,2001,2000
This statistics in other country:
Timeline:
This timeline shows a graph from 2000 to 2016 of Grenada. No data until 1999. Number of actual observations by date: 17.
Source name:
World Development Indicators
Source organization:
World Bank, International Debt Statistics.
Categories, topics:
External Debt
Last updated:
apr 23, 2017
Indicators value changes by year
Maximum:
1.682 mln
jan 1, 2011
At the date of observation
Value
Absolute change
Change from previous value
jan 1, 2004
31.0K
+31.0K
%
jan 1, 2005
319.0K
+288.0K
929.03%
jan 1, 2006
554.0K
+235.0K
73.67%
jan 1, 2007
1.138 mln
+584.0K
105.42%
jan 1, 2008
1.243 mln
+105.0K
9.23%
jan 1, 2009
1.357 mln
+114.0K
9.17%
jan 1, 2010
1.464 mln
+107.0K
7.89%
jan 1, 2011
1.682 mln
+218.0K
14.89%
jan 1, 2012
1.519 mln
-163.0K
-9.69%
jan 1, 2013
1.368 mln
-151.0K
-9.94%
jan 1, 2014
1.397 mln
+29.0K
2.12%
jan 1, 2015
1.331 mln
-66.0K
-4.72%
jan 1, 2016
1.436 mln
+105.0K
7.89%
Ranking of countries by current statistics by years


Comments: