29
/
en
AIzaSyAYiBZKx7MnpbEhh9jyipgxe19OcubqV5w
April 1, 2024
140890
Ghana
GHA
true
2
1
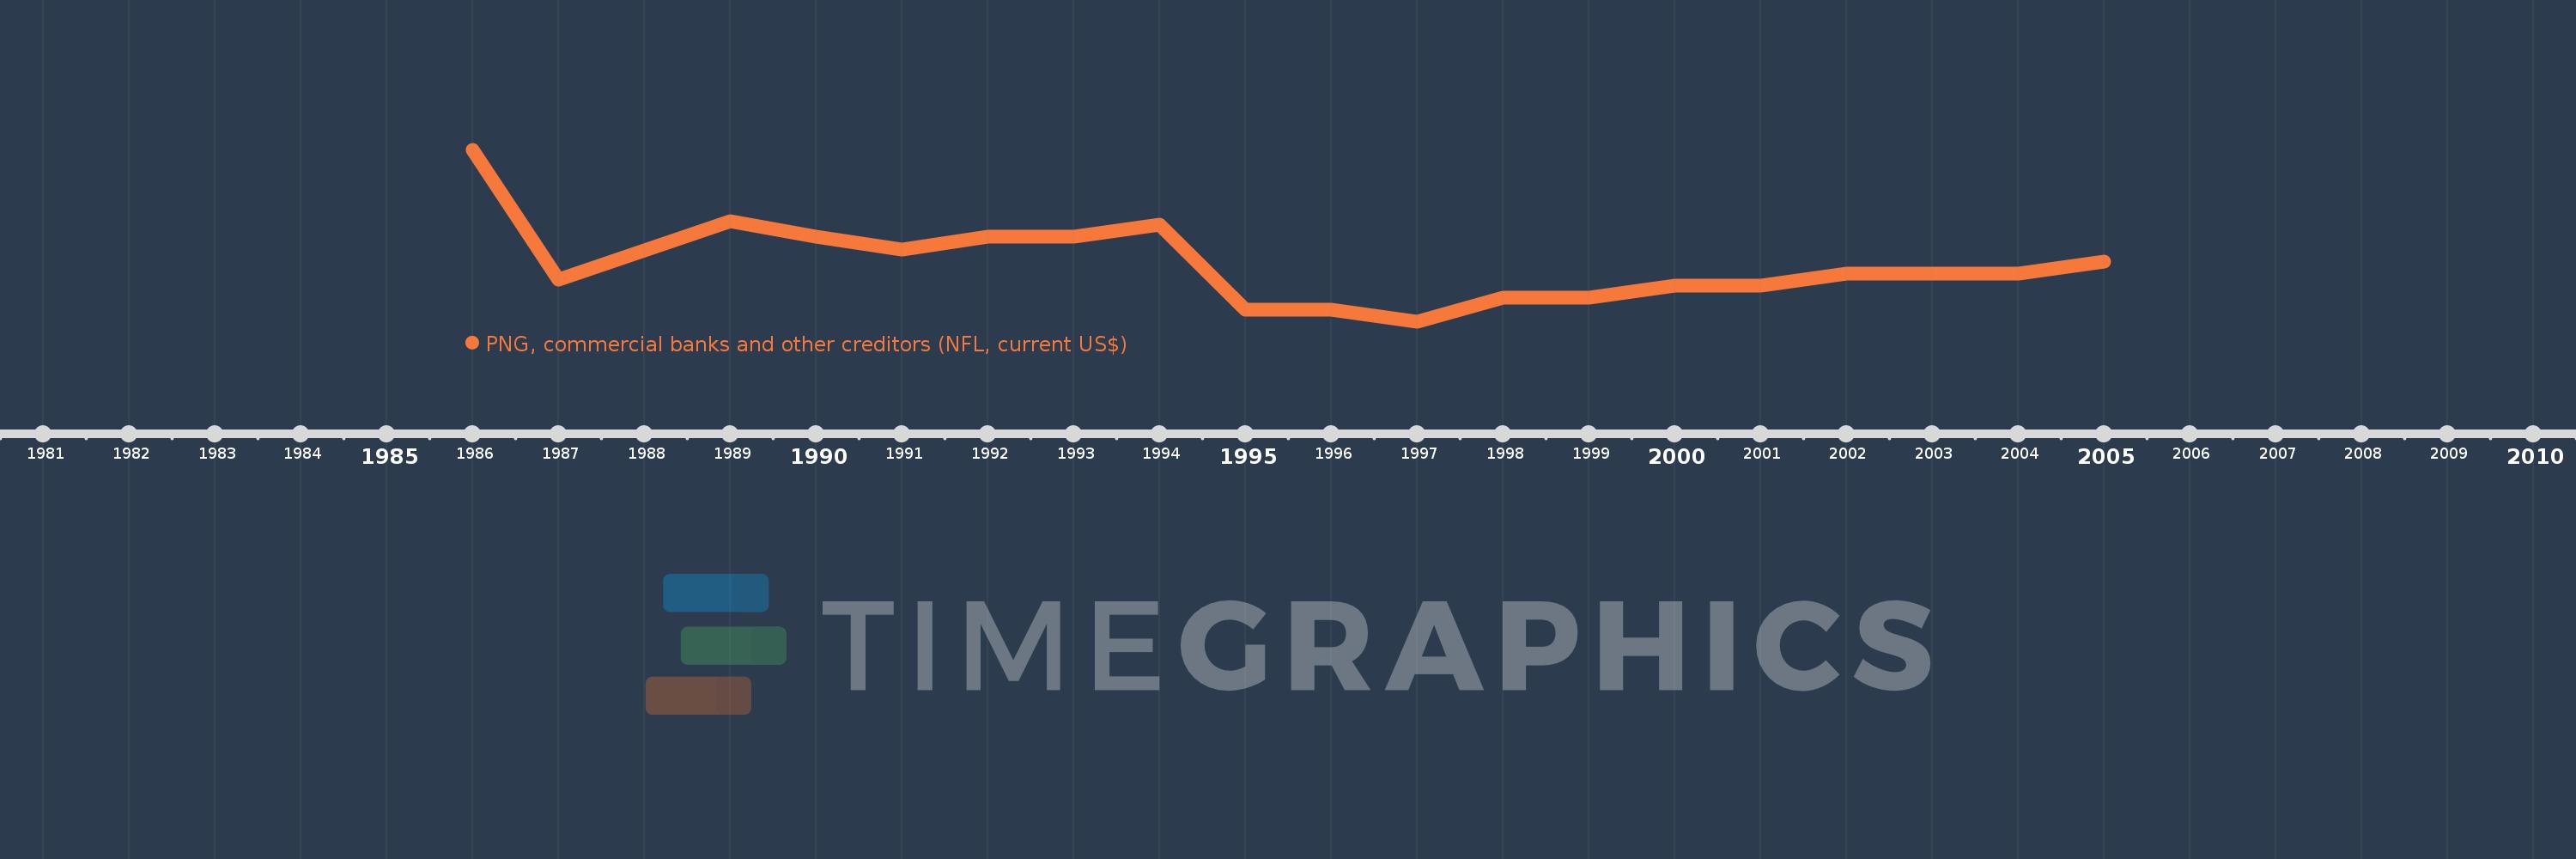
PNG, commercial banks and other creditors (NFL, current US$)
2005,2004,2003,2002,2001,2000,1999,1998,1997,1996,1995,1994,1993,1992,1991,1990,1989,1988,1987,1986
This statistics in other country:
Timeline:
This timeline shows a graph from 1986 to 2005 of Ghana. No data until 1985. Number of actual observations by date: 20.
Source name:
World Development Indicators
Source organization:
World Bank, International Debt Statistics.
Categories, topics:
External Debt
Last updated:
apr 23, 2017
Indicators value changes by year
Minimum:
-6.0 mln
jan 1, 1997
Maximum:
8.165 mln
jan 1, 1986
At the date of observation
Value
Absolute change
Change from previous value
jan 1, 1986
8.165 mln
+8.165 mln
0.0%
jan 1, 1987
-2.5 mln
-10.665 mln
-130.62%
jan 1, 1988
-99.0K
+2.401 mln
-96.04%
jan 1, 1989
2.333 mln
+2.432 mln
-2.46K%
jan 1, 1990
1000.0K
-1.333 mln
-57.14%
jan 1, 1991
0.0
-1000.0K
-100.0%
jan 1, 1992
1000.0K
+1000.0K
%
jan 1, 1993
1000.0K
0.0
0.0%
jan 1, 1994
2.0 mln
+1000.0K
100.0%
jan 1, 1995
-5.0 mln
-7.0 mln
-350.0%
jan 1, 1996
-5.0 mln
0.0
0.0%
jan 1, 1997
-6.0 mln
-1000.0K
20.0%
jan 1, 1998
-4.0 mln
+2.0 mln
-33.33%
jan 1, 1999
-4.0 mln
0.0
0.0%
jan 1, 2000
-3.0 mln
+1000.0K
-25.0%
jan 1, 2001
-3.0 mln
0.0
0.0%
jan 1, 2002
-2.0 mln
+1000.0K
-33.33%
jan 1, 2003
-2.0 mln
0.0
0.0%
jan 1, 2004
-2.0 mln
0.0
0.0%
jan 1, 2005
-1000.0K
+1000.0K
-50.0%
Ranking of countries by current statistics by years


Comments: