Download This statistics in other country:
Timeline:
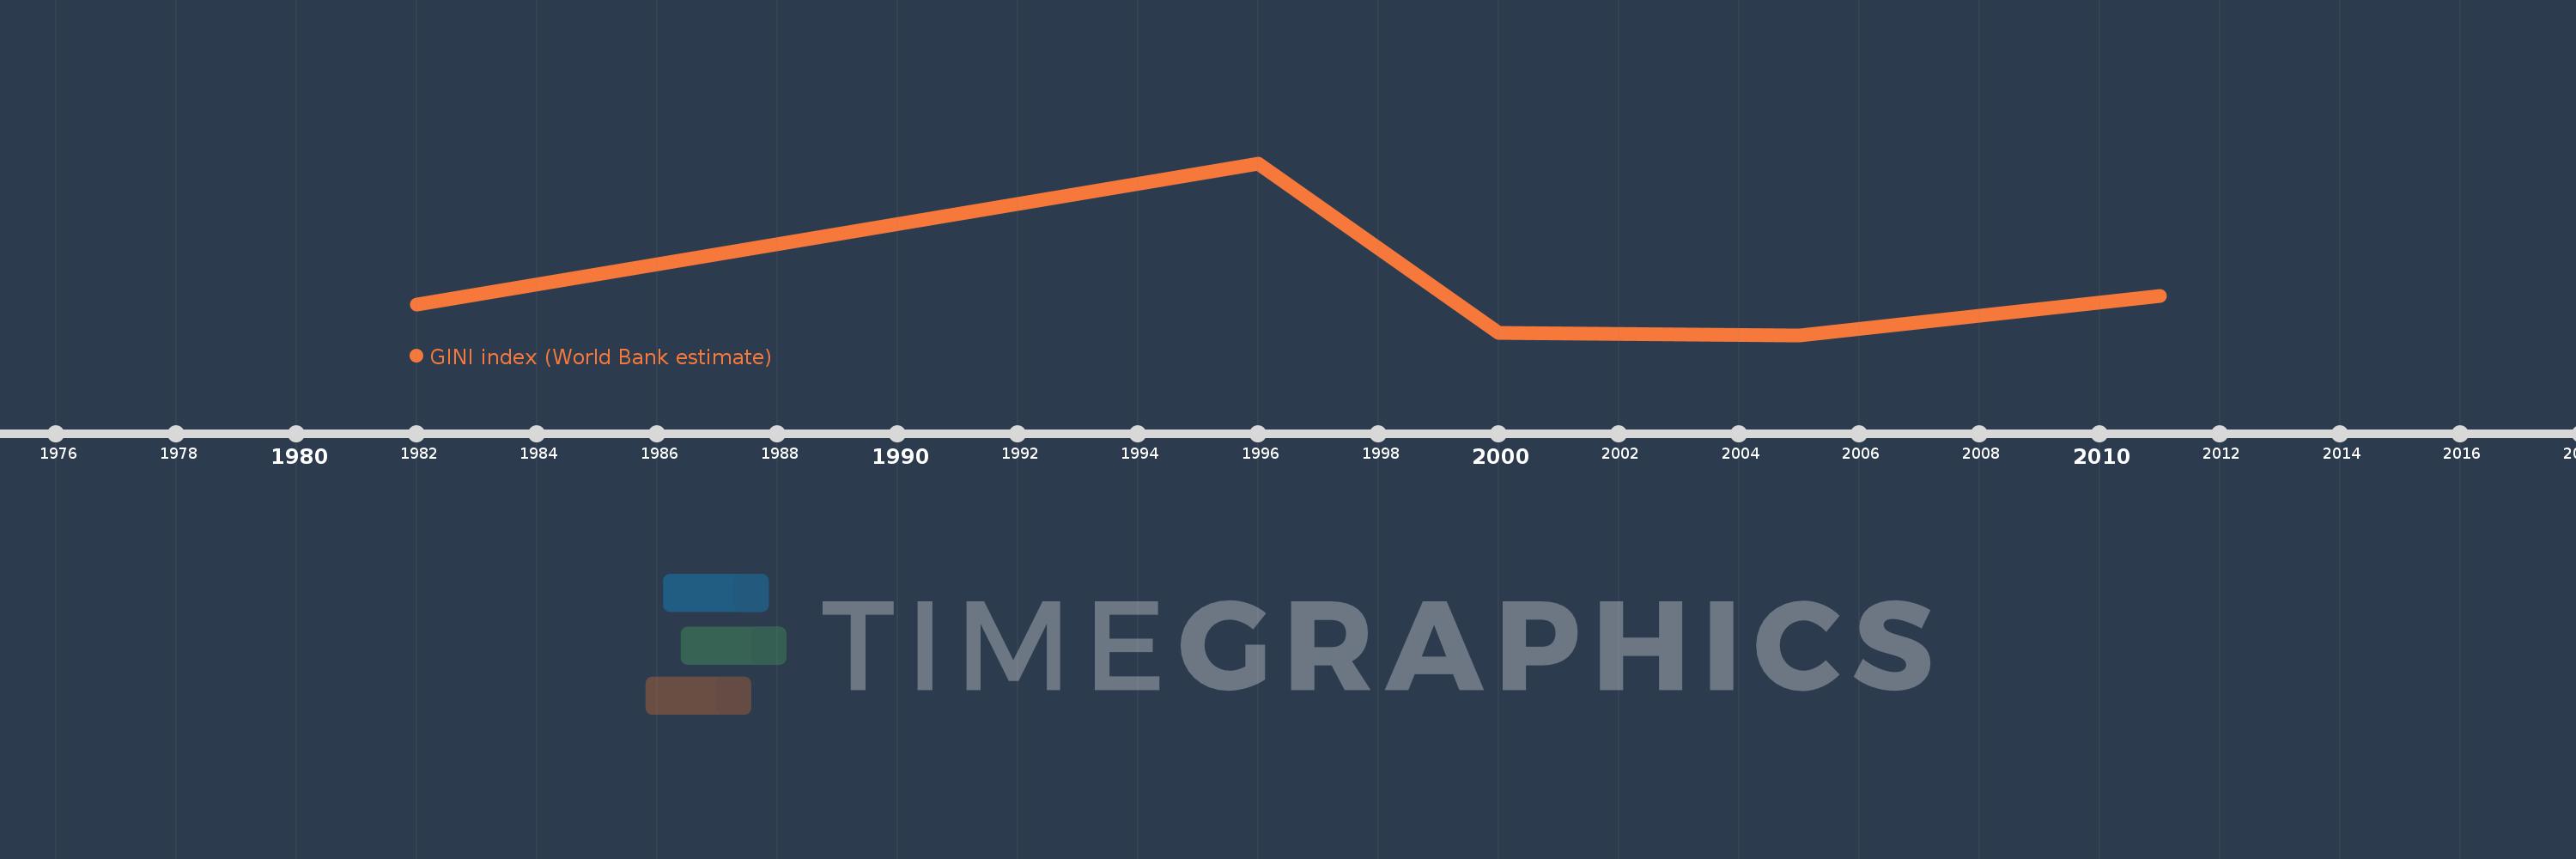
This timeline shows a graph from 1982 to 2011 of Ethiopia. No data until 1981. Number of actual observations by date: 5.
Source name:
World Development Indicators
Source organization:
World Bank, Development Research Group. Data are based on primary household survey data obtained from government statistical agencies and World Bank country departments. For more information and methodology, please see PovcalNet (http://iresearch.worldbank.org/PovcalNet/index.htm).
Categories, topics:
Poverty
Last updated:
apr 23, 2017
Indicators value changes by year
At the date of observation
Value
Absolute change
Change from the previous value
jan 1, 1982
32.42
+32.42
0.0%
jan 1, 1996
44.56
+12.14
37.45%
jan 1, 2000
29.98
-14.58
-32.72%
jan 1, 2005
29.81
-0.17
-0.57%
jan 1, 2011
33.17
+3.36
11.27%
Ranking of countries by current statistics by years
