29
/
en
AIzaSyAYiBZKx7MnpbEhh9jyipgxe19OcubqV5w
April 1, 2024
128110
Eritrea
ERI
true
2
1
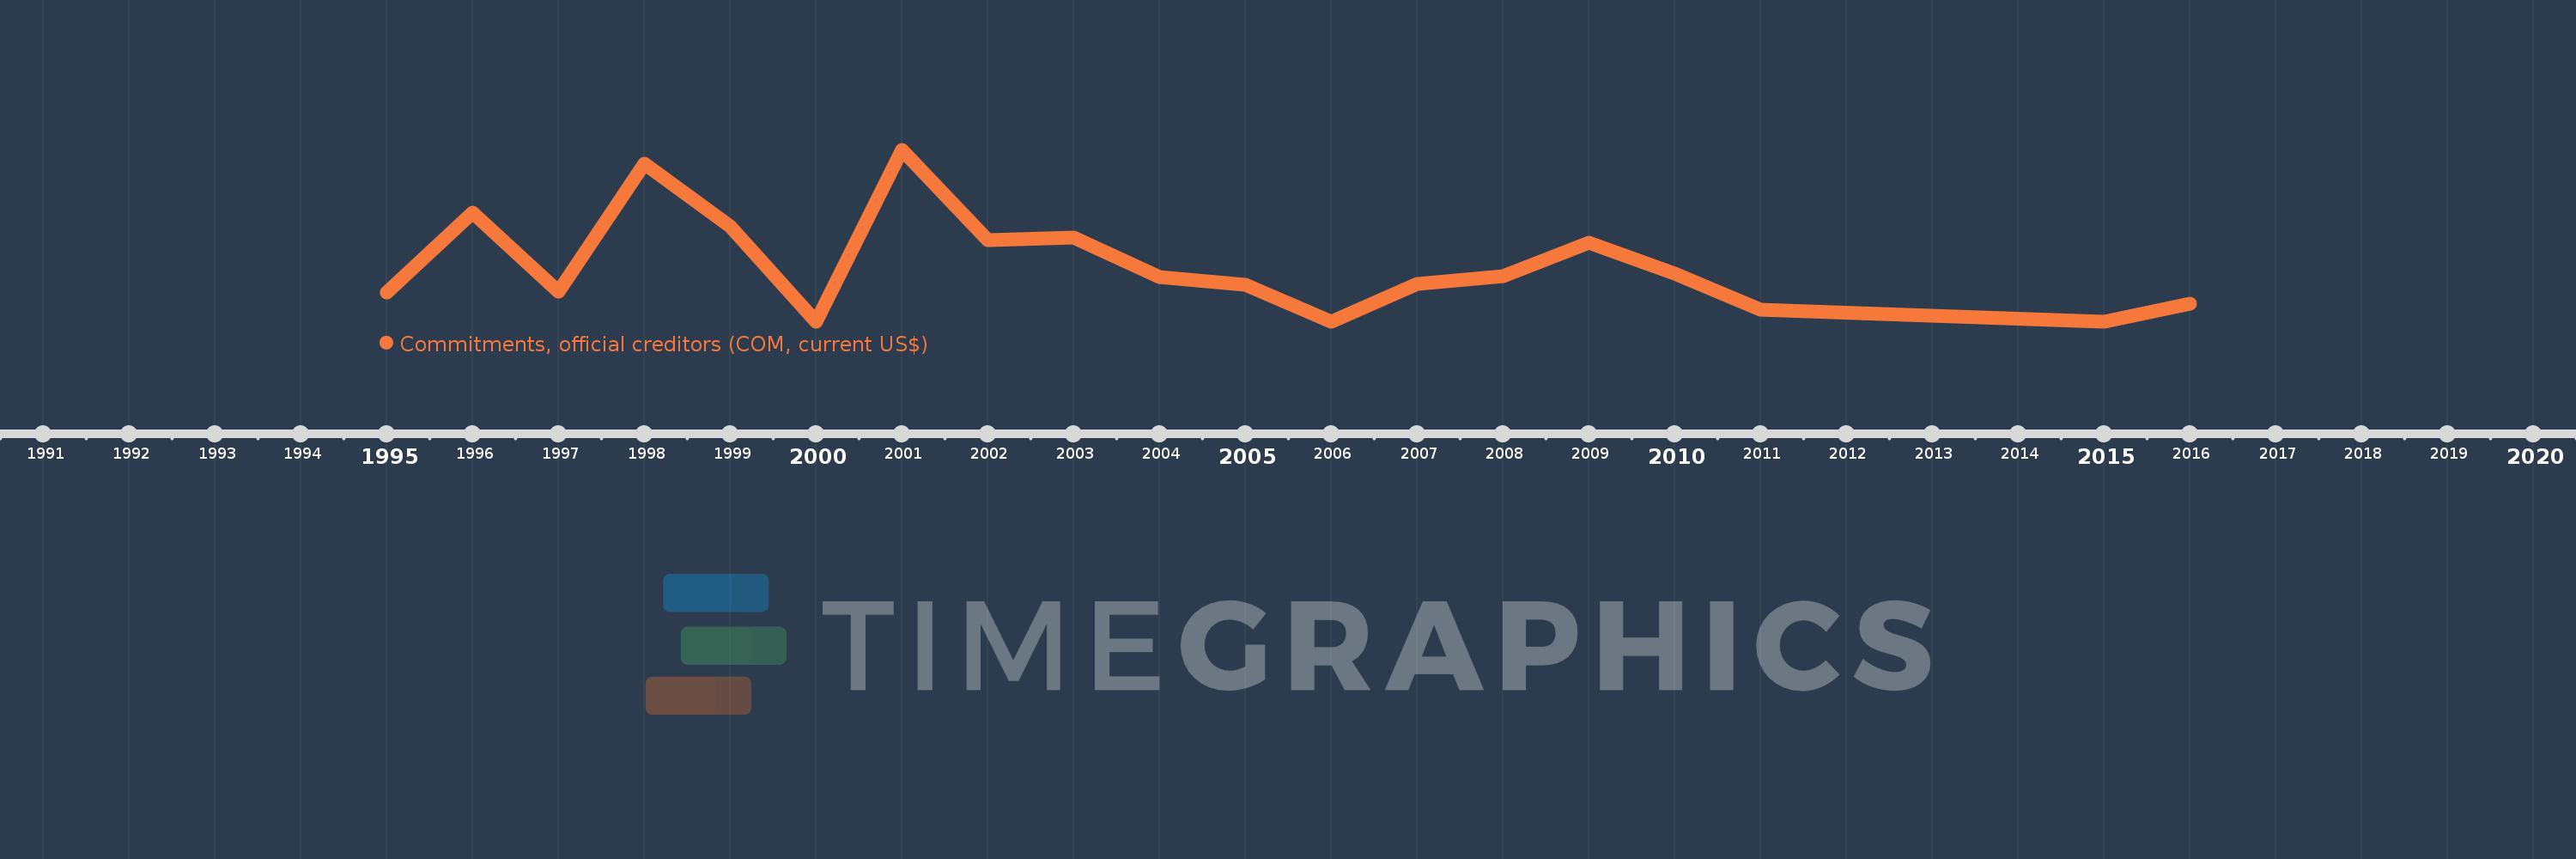
Commitments, official creditors (COM, current US$)
2016,2015,2011,2010,2009,2008,2007,2006,2005,2004,2003,2002,2001,2000,1999,1998,1997,1996,1995
This statistics in other country:
Timeline:
This timeline shows a graph from 1995 to 2016 of Eritrea. No data until 1994. Number of actual observations by date: 19.
Source name:
World Development Indicators
Source organization:
World Bank, International Debt Statistics.
Categories, topics:
External Debt
Last updated:
apr 23, 2017
Indicators value changes by year
Maximum:
173.624 mln
jan 1, 2001
At the date of observation
Value
Absolute change
Change from previous value
jan 1, 1995
29.789 mln
+29.789 mln
0.0%
jan 1, 1996
110.5 mln
+80.711 mln
270.94%
jan 1, 1997
30.528 mln
-79.972 mln
-72.37%
jan 1, 1998
159.612 mln
+129.084 mln
422.84%
jan 1, 1999
97.0 mln
-62.612 mln
-39.23%
jan 1, 2000
0.0
-97.0 mln
-100.0%
jan 1, 2001
173.624 mln
+173.624 mln
%
jan 1, 2002
82.827 mln
-90.797 mln
-52.3%
jan 1, 2003
85.488 mln
+2.661 mln
3.21%
jan 1, 2004
45.0 mln
-40.488 mln
-47.36%
jan 1, 2005
37.483 mln
-7.517 mln
-16.7%
jan 1, 2006
0.0
-37.483 mln
-100.0%
jan 1, 2007
38.534 mln
+38.534 mln
%
jan 1, 2008
46.349 mln
+7.815 mln
20.28%
jan 1, 2009
80.0 mln
+33.651 mln
72.6%
jan 1, 2010
48.932 mln
-31.068 mln
-38.83%
jan 1, 2011
12.6 mln
-36.332 mln
-74.25%
jan 1, 2015
0.0
-12.6 mln
-100.0%
jan 1, 2016
18.65 mln
+18.65 mln
%
Ranking of countries by current statistics by years


Comments: