30
/
AIzaSyAYiBZKx7MnpbEhh9jyipgxe19OcubqV5w
April 1, 2024
126064
El Salvador
SLV
true
2
1
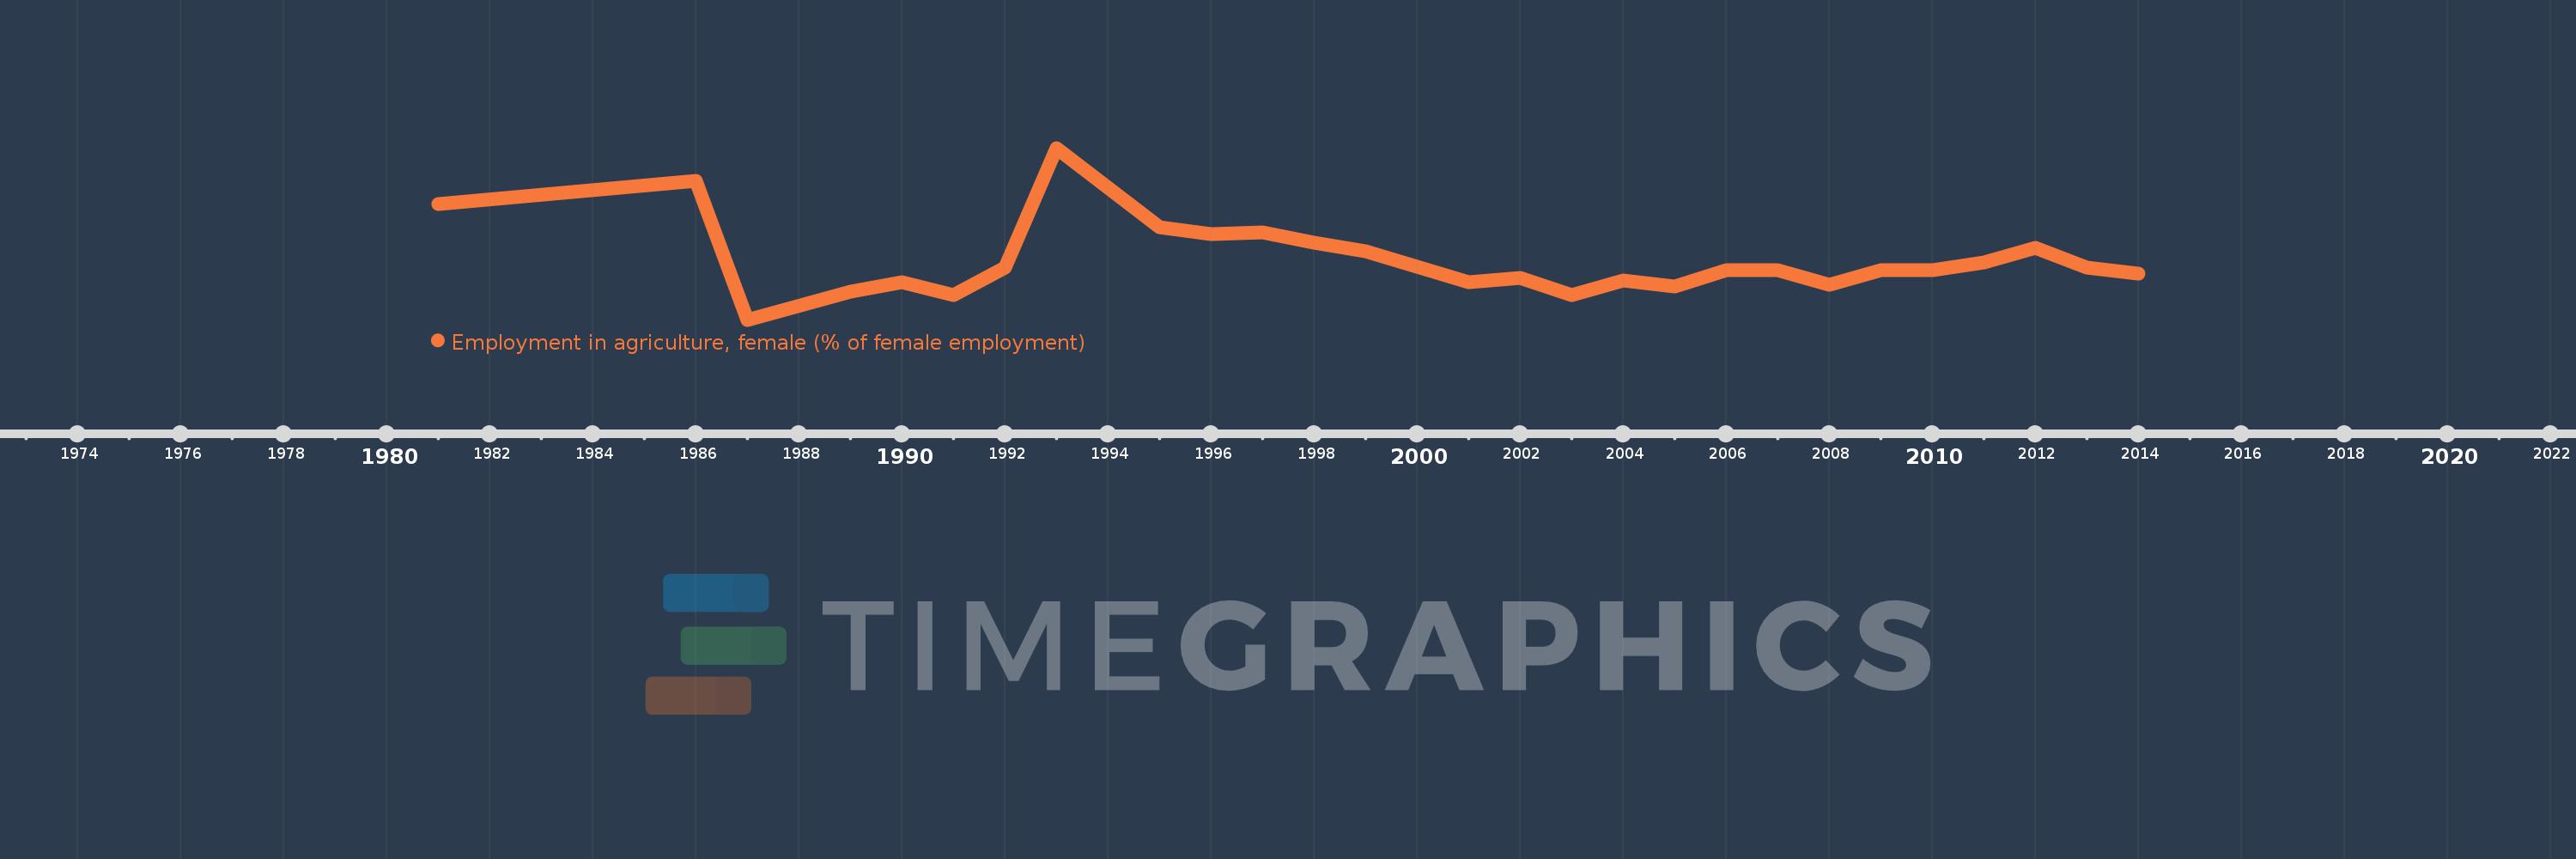
Employment in agriculture, female (% of female employment)
2014,2013,2012,2011,2010,2009,2008,2007,2006,2005,2004,2003,2002,2001,1999,1998,1997,1996,1995,1993,1992,1991,1990,1989,1987,1986,1981
