Download This statistics in other country:
Timeline:
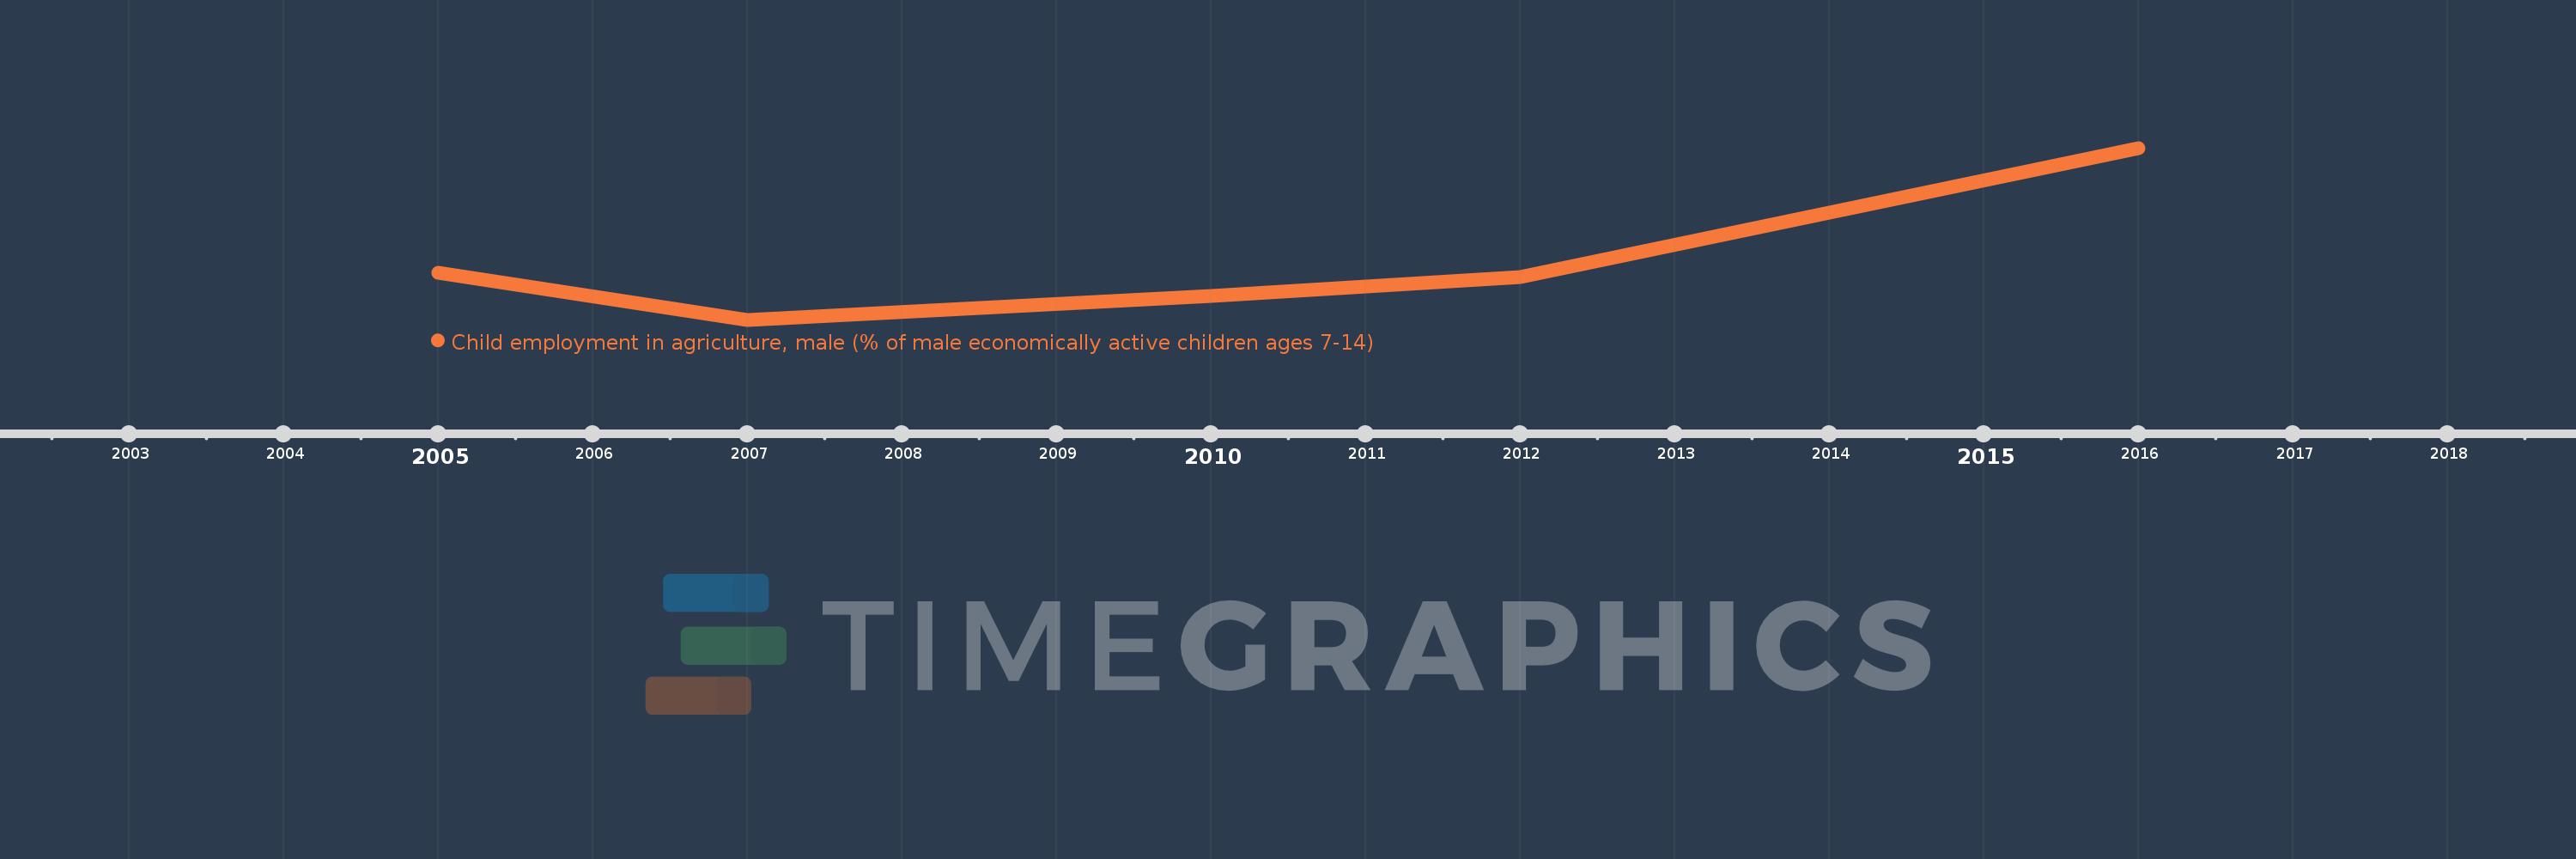
This timeline shows a graph from 2005 to 2016 of Ecuador. No data until 2004. Number of actual observations by date: 5.
Source name:
World Development Indicators
Source organization:
Understanding Children's Work project based on data from ILO, UNICEF and the World Bank.
Categories, topics:
Social Protection & Labor, Gender
Last updated:
apr 23, 2017
Indicators value changes by year
At the date of observation
Value
Absolute change
Change from the previous value
jan 1, 2005
71.2
+71.2
0.0%
jan 1, 2007
68.11
-3.09
-4.34%
jan 1, 2010
69.65
+1.54
2.26%
jan 1, 2012
70.88
+1.23
1.77%
jan 1, 2016
79.33
+8.45
11.92%
Ranking of countries by current statistics by years
