Download This statistics in other country:
Timeline:
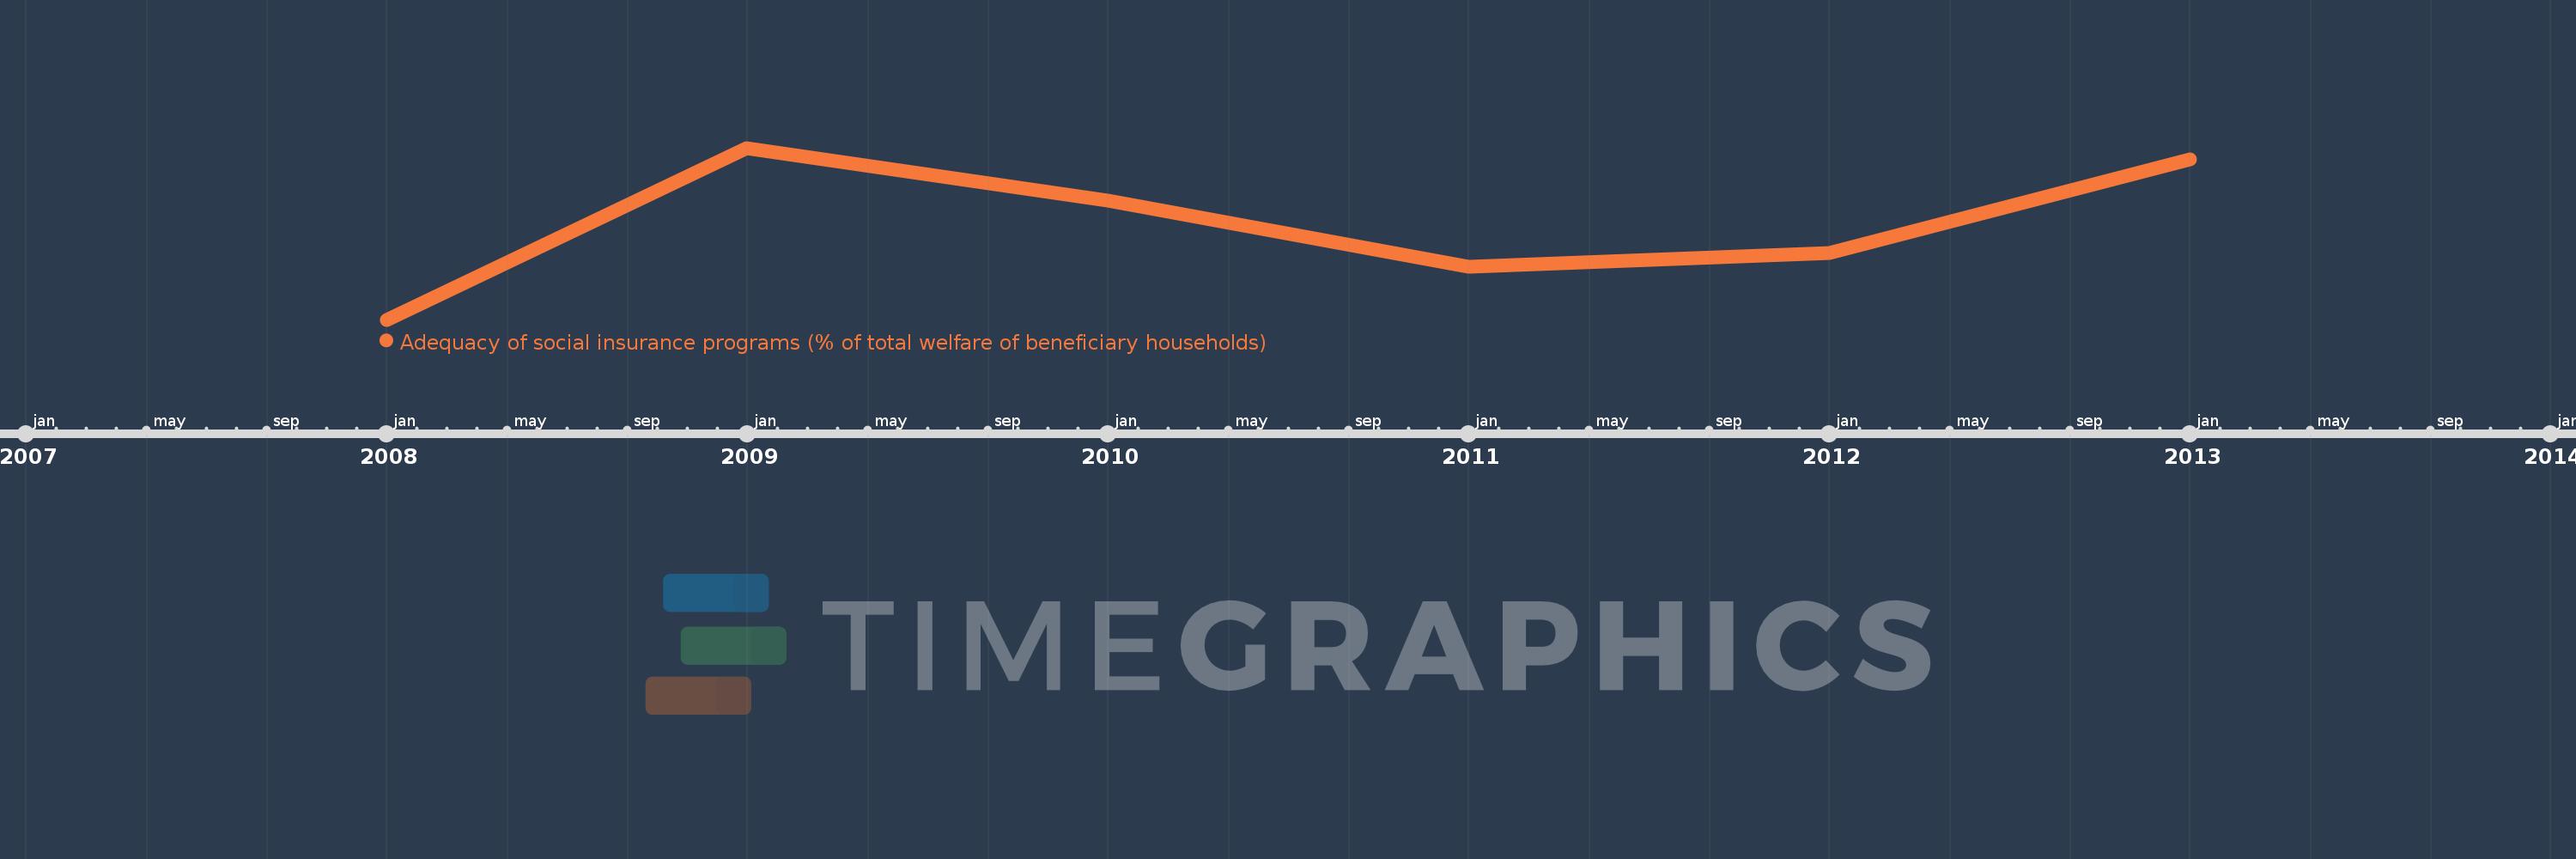
This timeline shows a graph from 2008 to 2013 of Dominican Republic. No data until 2007. Number of actual observations by date: 6.
Source name:
World Development Indicators
Source organization:
The Atlas of Social Protection: Indicators of Resilience and Equity (ASPIRE)
Categories, topics:
Social Protection & Labor
Last updated:
apr 23, 2017
Indicators value changes by year
Minimum:
23.213
jan 1, 2008
Maximum:
27.758
jan 1, 2009
At the date of observation
Value
Absolute change
Change from the previous value
jan 1, 2008
23.213
+23.213
0.0%
jan 1, 2009
27.758
+4.545
19.58%
jan 1, 2010
26.362
-1.397
-5.03%
jan 1, 2011
24.621
-1.741
-6.6%
jan 1, 2012
24.972
+0.352
1.43%
jan 1, 2013
27.452
+2.479
9.93%
Ranking of countries by current statistics by years
