29
/
en
AIzaSyAYiBZKx7MnpbEhh9jyipgxe19OcubqV5w
April 1, 2024
110616
Congo, Rep.
COG
true
2
1
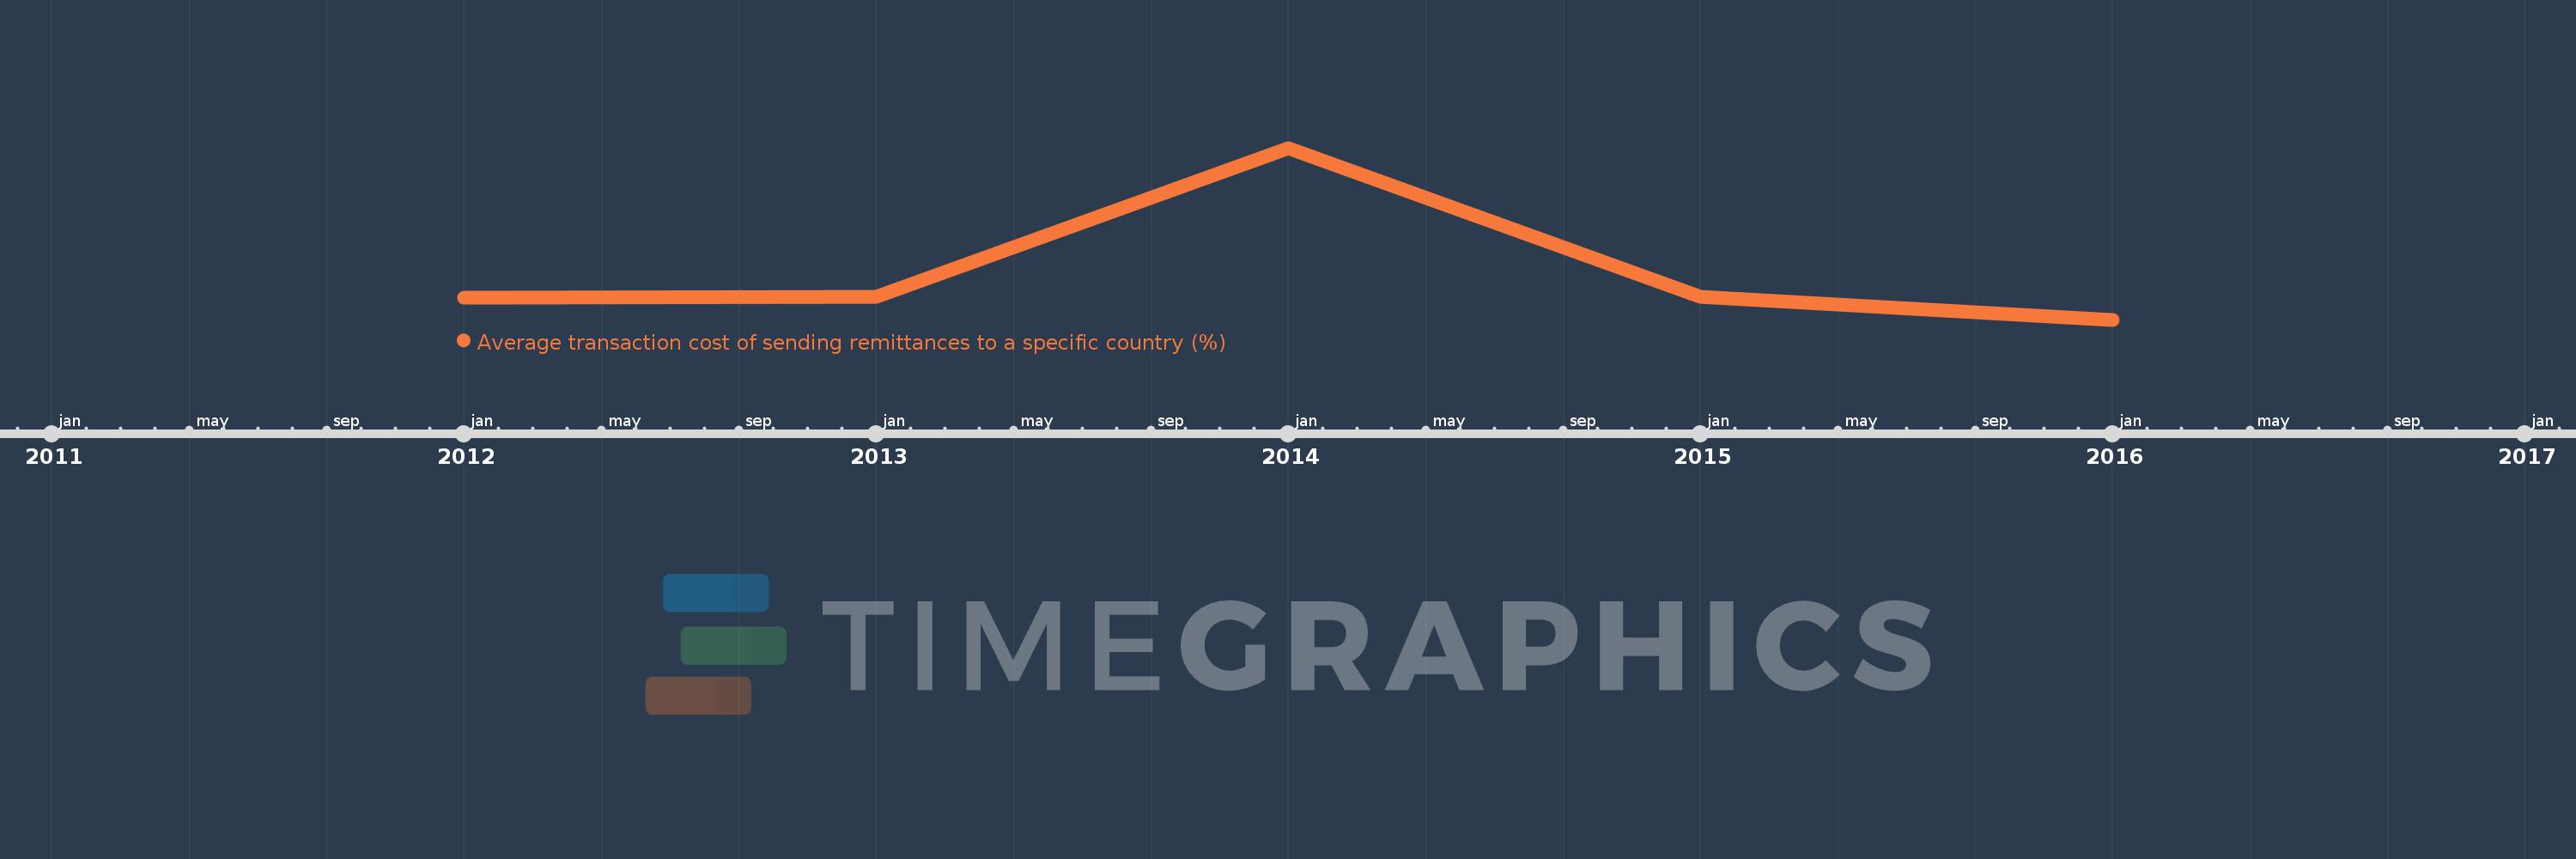
Average transaction cost of sending remittances to a specific country (%)
2016,2015,2014,2013,2012
This statistics in other country:
Timeline:
This timeline shows a graph from 2012 to 2016 of Congo, Rep.. No data until 2011. Number of actual observations by date: 5.
Source name:
World Development Indicators
Source organization:
World Bank, Remittance Prices Worldwide, available at http://remittanceprices.worldbank.org
Categories, topics:
Financial Sector
Last updated:
apr 23, 2017
Indicators value changes by year
Maximum:
10.401
jan 1, 2014
At the date of observation
Value
Absolute change
Change from previous value
jan 1, 2012
8.329
+8.329
0.0%
jan 1, 2013
8.337
+0.008
0.09%
jan 1, 2014
10.401
+2.064
24.76%
jan 1, 2015
8.341
-2.06
-19.81%
jan 1, 2016
8.021
-0.32
-3.84%
Ranking of countries by current statistics by years


Comments: