Download This statistics in other country:
Timeline:
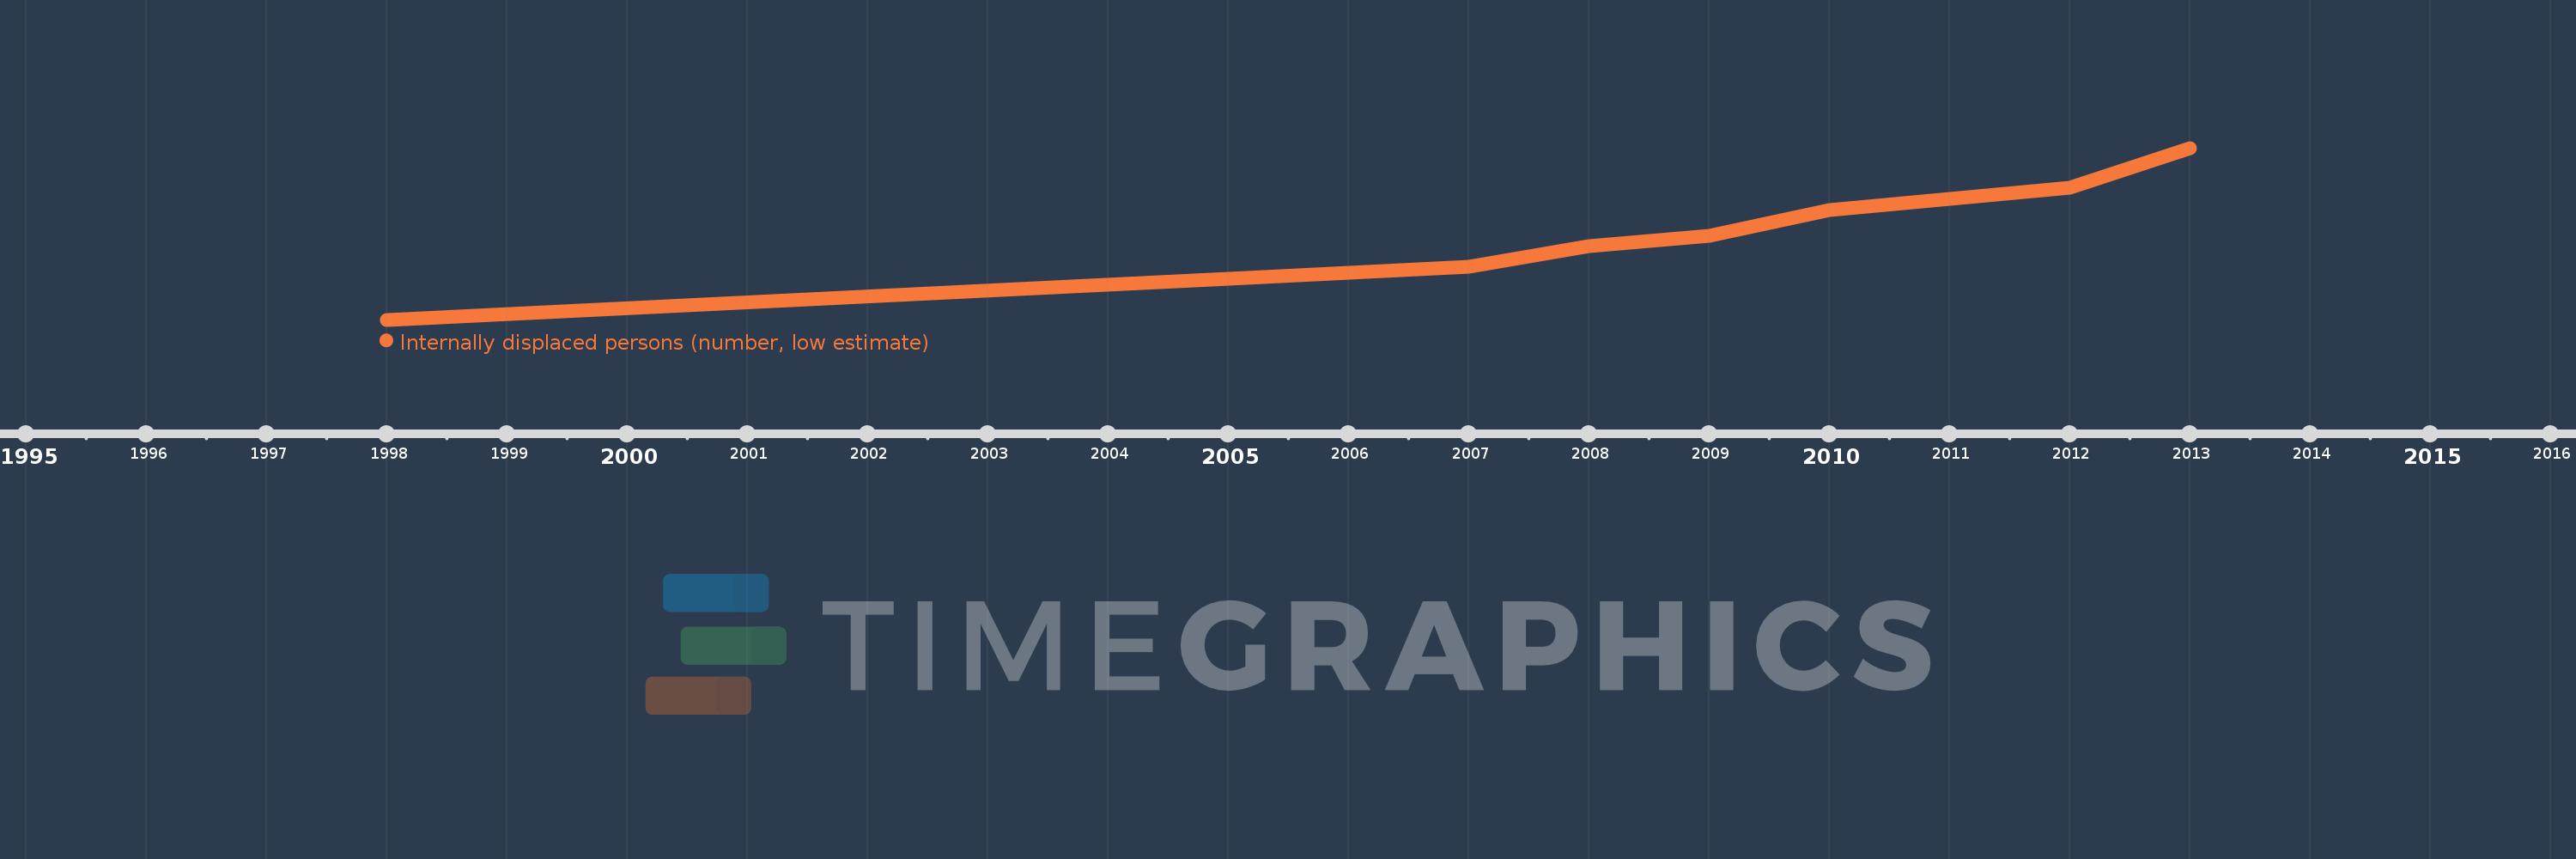
This timeline shows a graph from 1998 to 2013 of Colombia. No data until 1997. Number of actual observations by date: 10.
Source name:
World Development Indicators
Source organization:
Internal Displacement Monitoring Centre.
Categories, topics:
Public Sector
Last updated:
apr 23, 2017
Indicators value changes by year
Minimum:
500.0K
jan 1, 1998
Maximum:
4.9 mln
jan 1, 2013
At the date of observation
Value
Absolute change
Change from the previous value
jan 1, 1998
500.0K
+500.0K
0.0%
jan 1, 2005
1.553 mln
+1.053 mln
210.6%
jan 1, 2006
1.706 mln
+153.459K
9.88%
jan 1, 2007
1.853 mln
+146.541K
8.59%
jan 1, 2008
2.39 mln
+537.0K
28.98%
jan 1, 2009
2.65 mln
+260.0K
10.88%
jan 1, 2010
3.3 mln
+650.0K
24.53%
jan 1, 2011
3.6 mln
+300.0K
9.09%
jan 1, 2012
3.876 mln
+276.0K
7.67%
jan 1, 2013
4.9 mln
+1.024 mln
26.42%
Ranking of countries by current statistics by years
