29
/pt/
pt
AIzaSyAYiBZKx7MnpbEhh9jyipgxe19OcubqV5w
April 1, 2024
87293
Bolivia
BOL
true
2
1
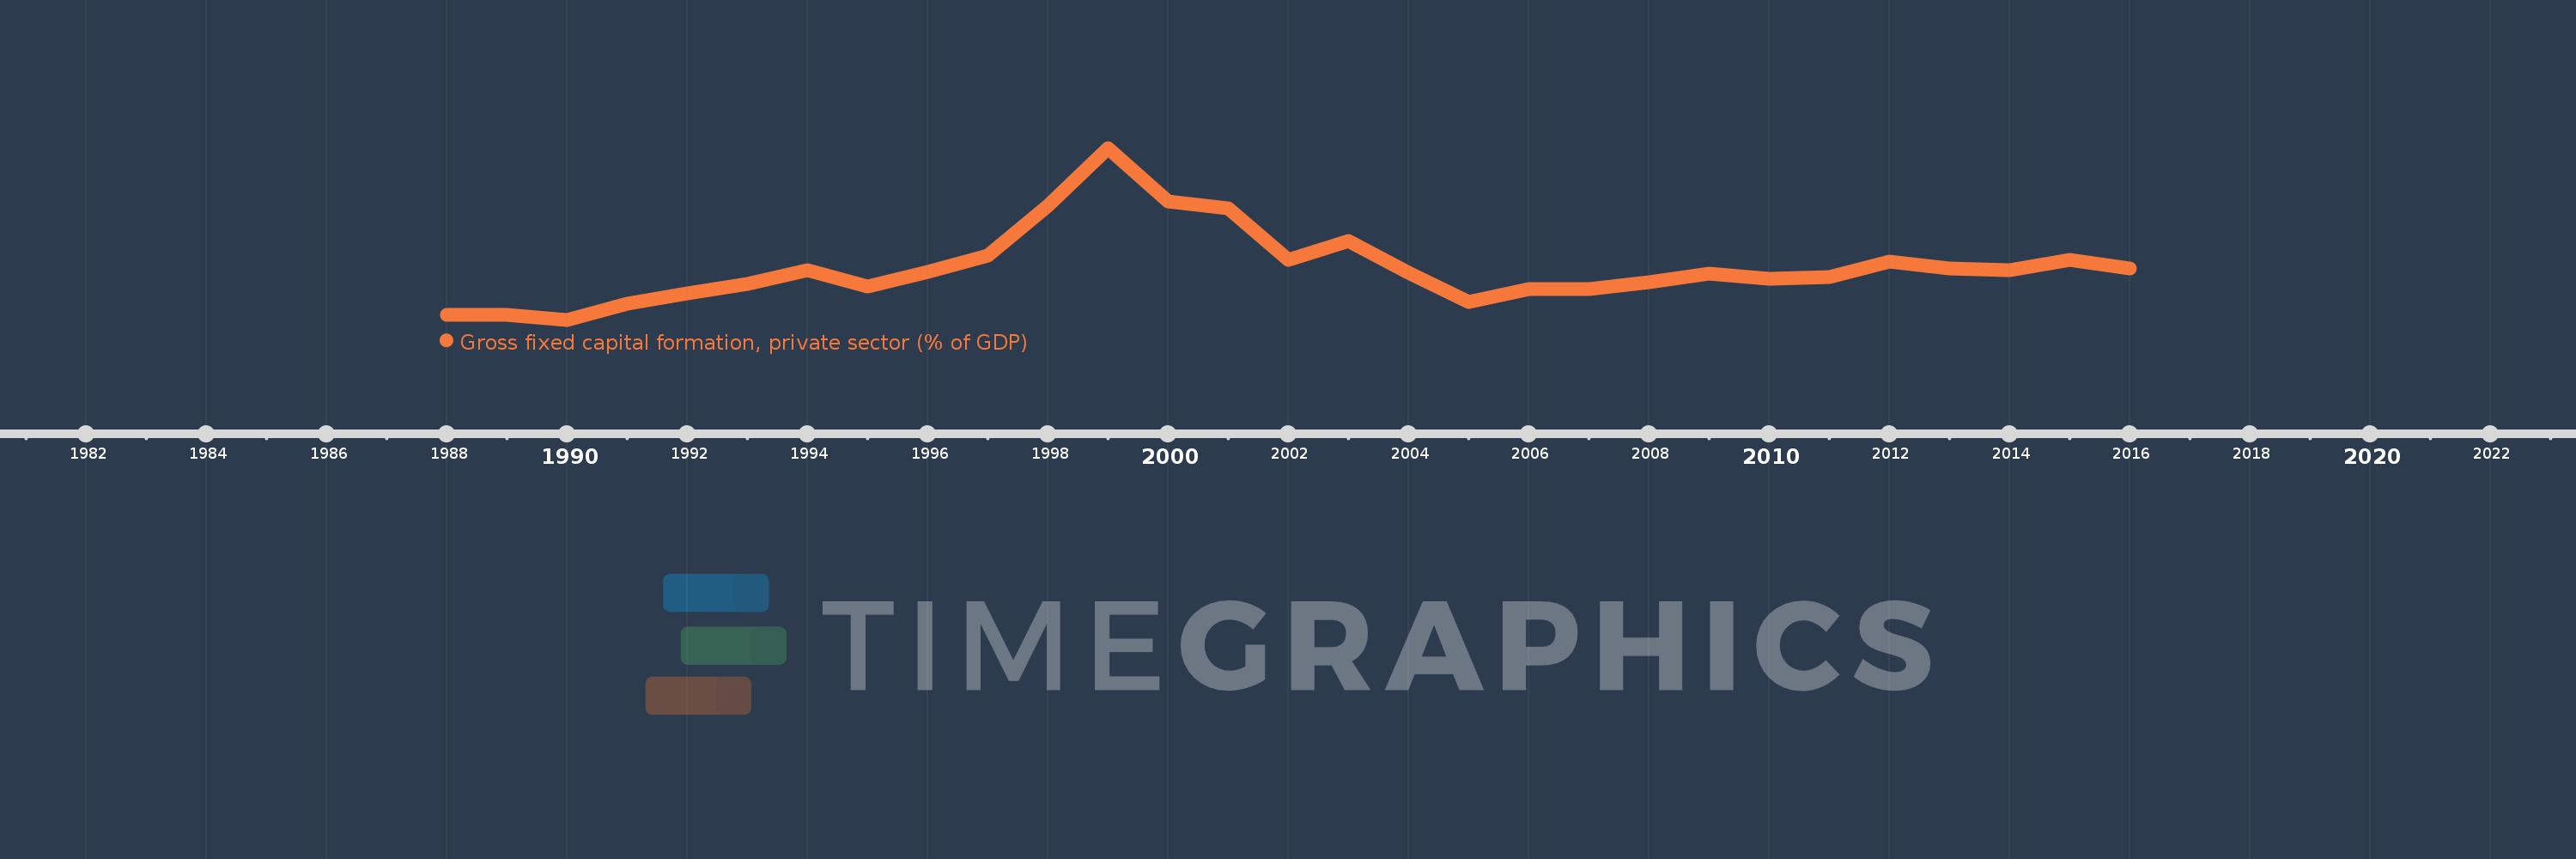
Gross fixed capital formation, private sector (% of GDP)
2016,2015,2014,2013,2012,2011,2010,2009,2008,2007,2006,2005,2004,2003,2002,2001,2000,1999,1998,1997,1996,1995,1994,1993,1992,1991,1990,1989,1988
Estas estatísticas em outros países:
Linha do tempo:
Nesta escala de tempo está apresentado um gráfico de 1988 ano até 2016 ano Bolivia. Dados de 1987 ano ausente. O número de observações reais por data: 29.
Fonte (nome):
Indicadores de desenvolvimento mundial
Fonte (organização):
World Bank national accounts data, and OECD National Accounts data files.
Categorias:
Economy & Growth
Foi atualizado:
23 abr 2017 ano
Indicadores de alterações dos valores ao longo dos anos
Mínimo:
3.609
1 jan 1990 ano
Máximo:
17.842
1 jan 1999 ano
Na data de observação
Valor
Mudança absoluta
A alteração em relação ao valor anterior
1 jan 1988 ano
4.013
+4.013
0.0%
1 jan 1989 ano
3.987
-0.025
-0.64%
1 jan 1990 ano
3.609
-0.379
-9.49%
1 jan 1991 ano
4.95
+1.342
37.18%
1 jan 1992 ano
5.787
+0.836
16.9%
1 jan 1993 ano
6.606
+0.82
14.17%
1 jan 1994 ano
7.71
+1.104
16.7%
1 jan 1995 ano
6.372
-1.338
-17.35%
1 jan 1996 ano
7.582
+1.21
19.0%
1 jan 1997 ano
8.911
+1.329
17.53%
1 jan 1998 ano
13.088
+4.176
46.86%
1 jan 1999 ano
17.842
+4.754
36.32%
1 jan 2000 ano
13.431
-4.411
-24.72%
1 jan 2001 ano
12.822
-0.609
-4.54%
1 jan 2002 ano
8.552
-4.269
-33.3%
1 jan 2003 ano
10.124
+1.572
18.38%
1 jan 2004 ano
7.491
-2.633
-26.01%
1 jan 2005 ano
5.104
-2.387
-31.87%
1 jan 2006 ano
6.125
+1.021
20.01%
1 jan 2007 ano
6.178
+0.053
0.87%
1 jan 2008 ano
6.713
+0.535
8.65%
1 jan 2009 ano
7.456
+0.743
11.06%
1 jan 2010 ano
6.974
-0.482
-6.47%
1 jan 2011 ano
7.122
+0.148
2.13%
1 jan 2012 ano
8.429
+1.307
18.36%
1 jan 2013 ano
7.832
-0.598
-7.09%
1 jan 2014 ano
7.749
-0.083
-1.06%
1 jan 2015 ano
8.571
+0.822
10.61%
1 jan 2016 ano
7.829
-0.742
-8.66%
Classificação de países por estatísticas atuais por anos


Comentários: